I’m currently open to new job opportunities or projects. I would love to hear from you. Please reach out via my connect page.
I’m a prolific and professional graphic designer whose work has been featured by SantoriniDave.com, Gizmodo, The Journal of the American Medical Association (JAMA), MSN.com, Moz and other publications.
I’m versed in creating for multiple outlets like print, digital, and animated gifs for websites, blog posts, magazines, books, and reports.
I transform information into engaging narratives using icons, images, charts, and illustrations. Collaborating with researchers, writers, and data analysts helps to shape an accurate and helpful graphic. I completed a one-day Infographic course at the School of Visual Concepts in Seattle and attended an Edward Tufte seminar on Visual Information.
I design unique maps for travel, to show geographic data and comparisons using Adobe Illustrator. I’ve hand-drawn maps and scanned them, altered provided maps, and created new maps from OpenStreetMap.
The gifs I’ve created have been for social media. I completed a month-long Adobe After Effects class at the School of Visual concepts in Seattle. I’ve animated charts to reveal the main takeaway and maps to show change over time including added text to help tell the story.
Design
Adobe: InDesign, Illustrator, Photoshop, Acrobat, After Effects
Apple Photos
Maps
openstreetmap.org
Google Maps
Apple Maps
Words
Grammarly
Chat GPT
Accessibility
Web Contrast Checker
Adobe Illustrator Color Blindness Proofing
Organization
Google: Docs, Sheets, Maps
Communication
Slack
Email
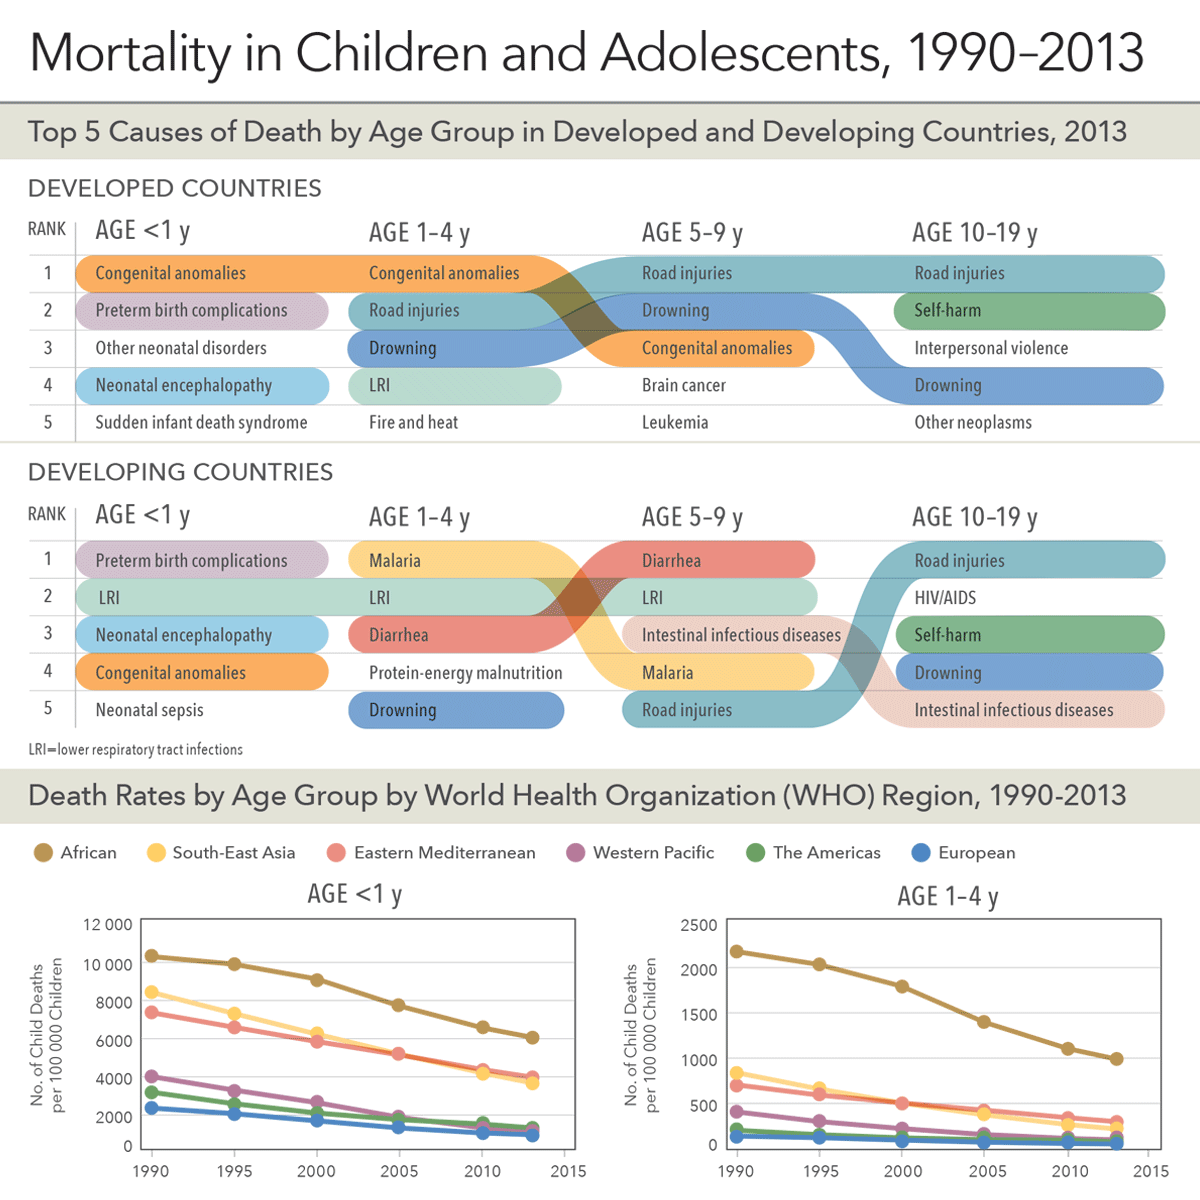
Cited as an author in The Journal of the American Medical Association (JAMA) for 6 published infographics. These were created in collaboration with JAMA and the Institute for Health Metrics and Evaluation.
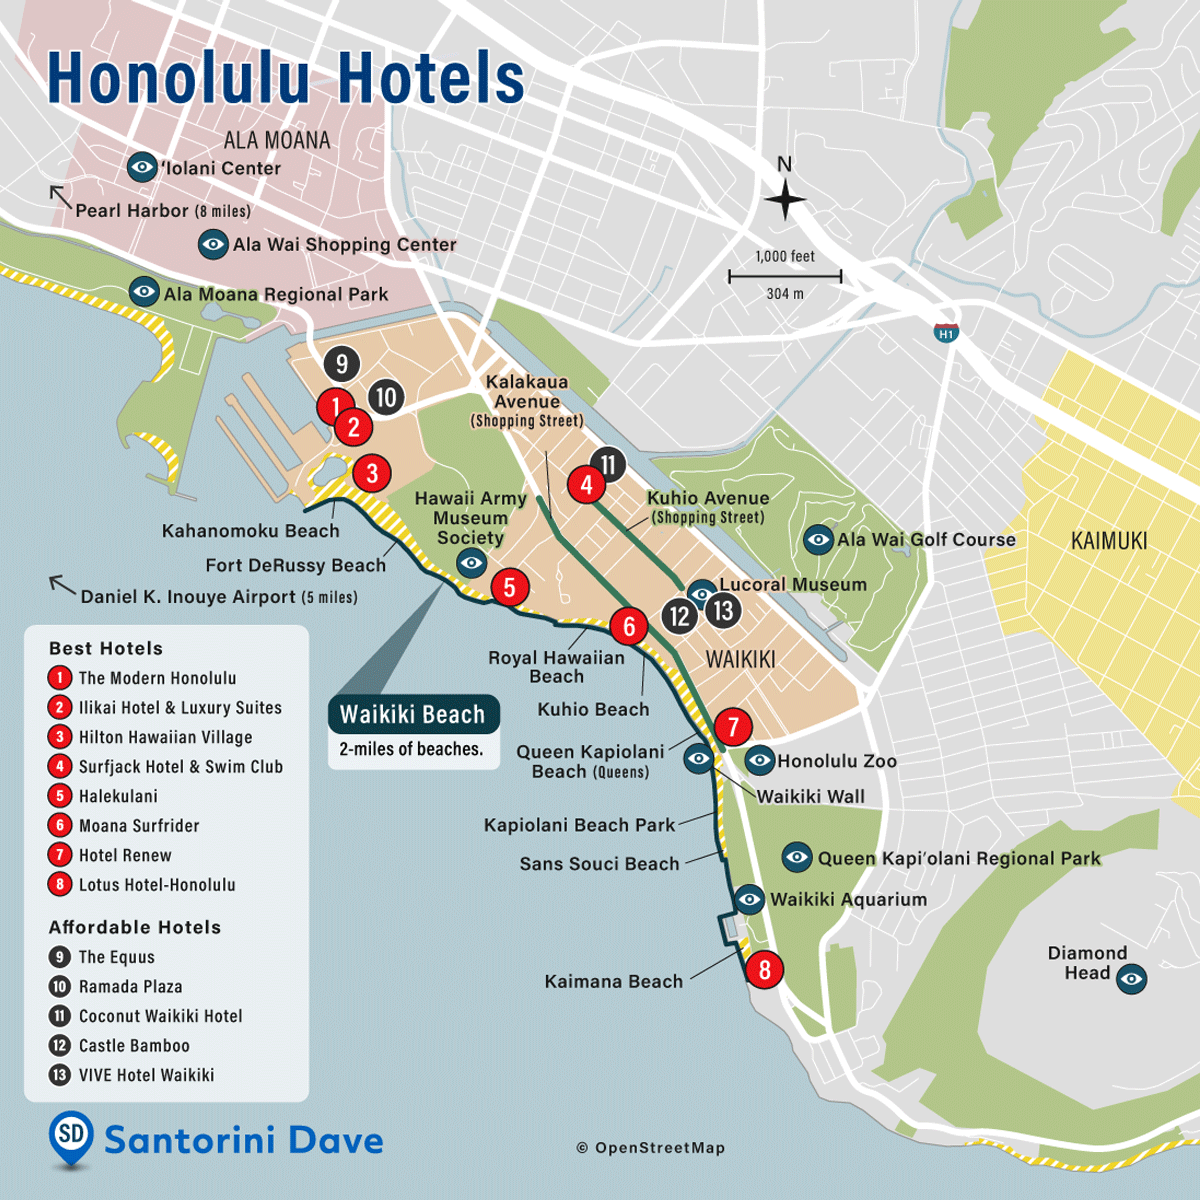
Illustrated and designed hundreds of travel maps and graphics for articles at SantoriniDave.com.
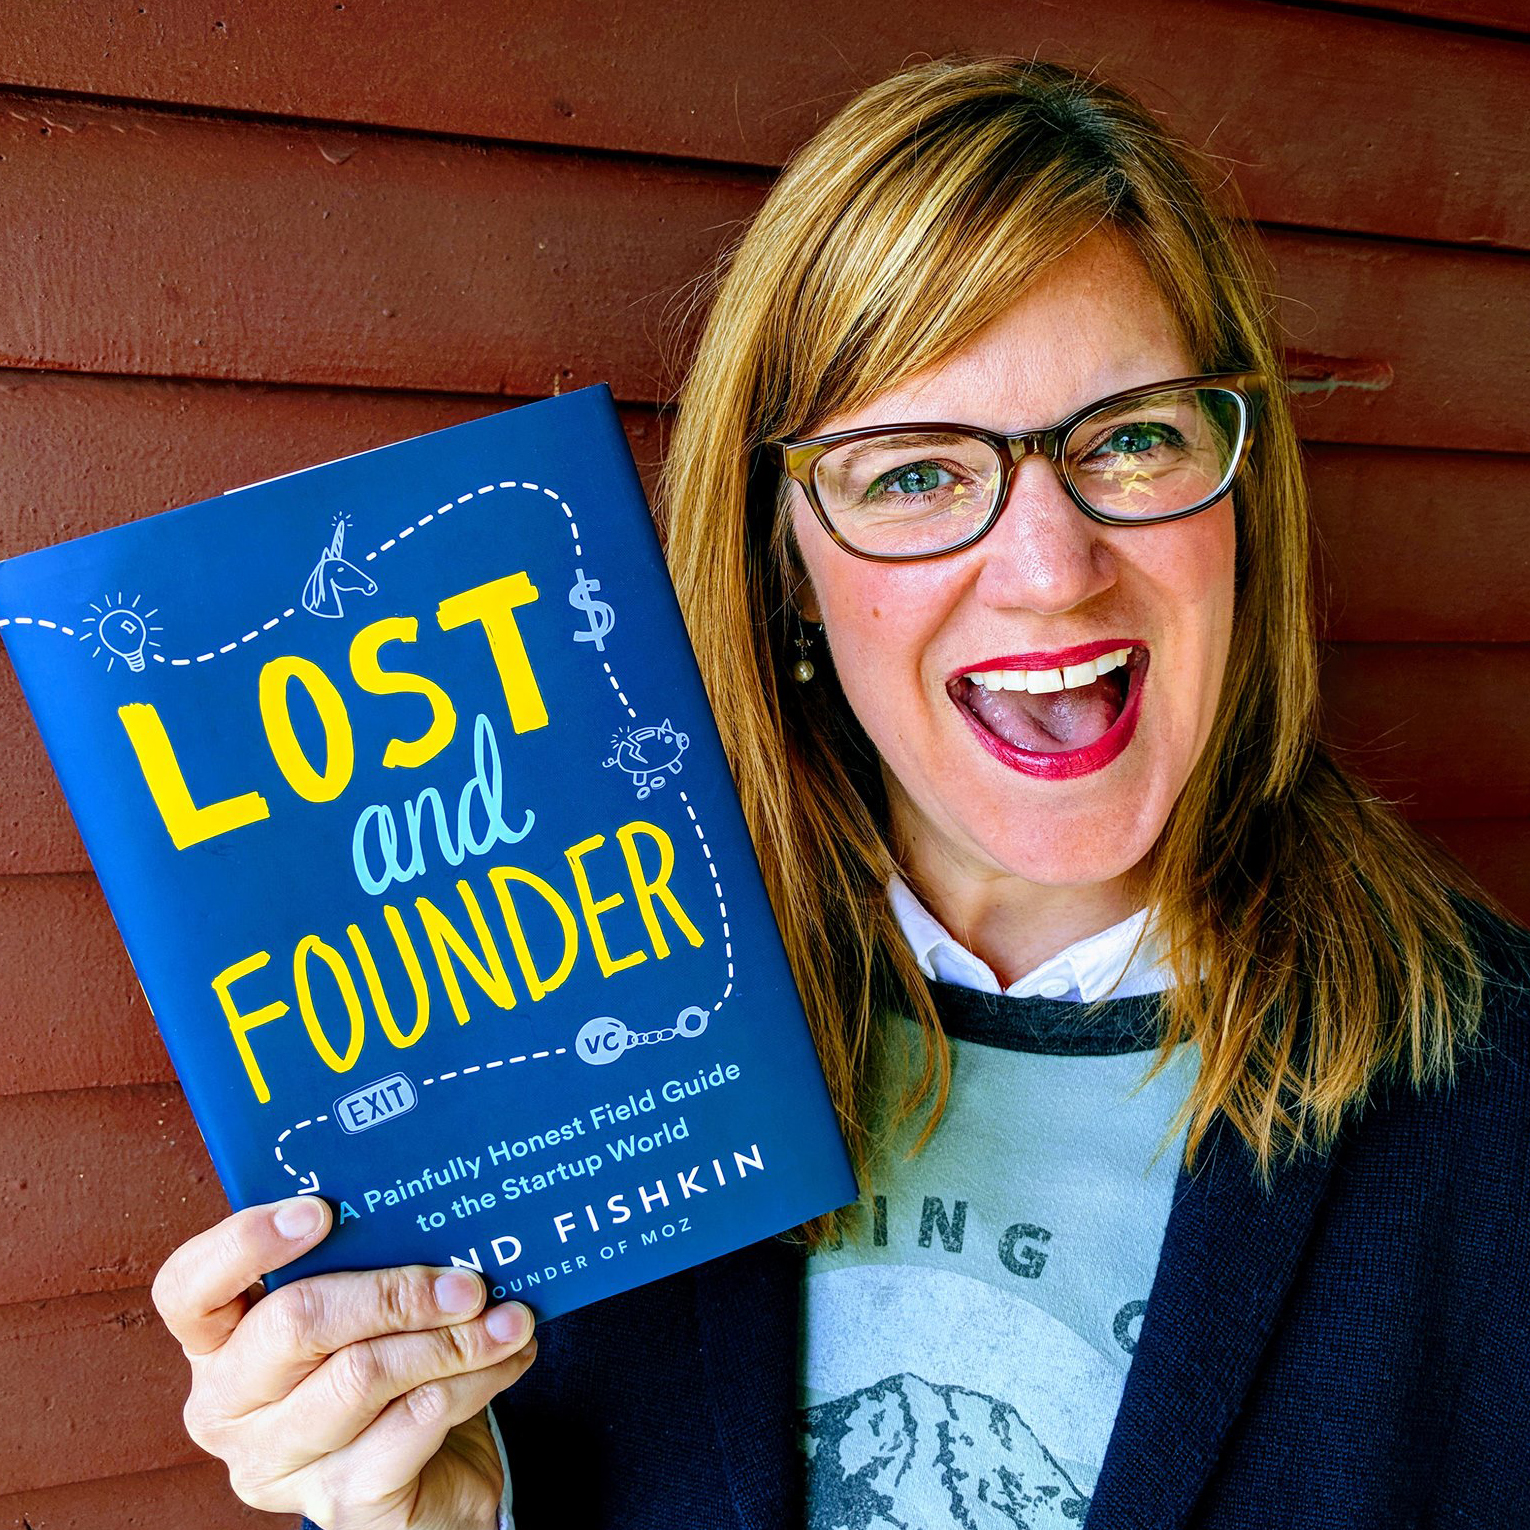
Designed the Lost and Founder book cover and did the inside chart illustrations.
Created multiple successful infographics published on MSN.com. Designed weekly graphics for publication on multiple MSN.com channels including MSNnow, Entertainment, Causes, Money, Healthy Living, and Weather.
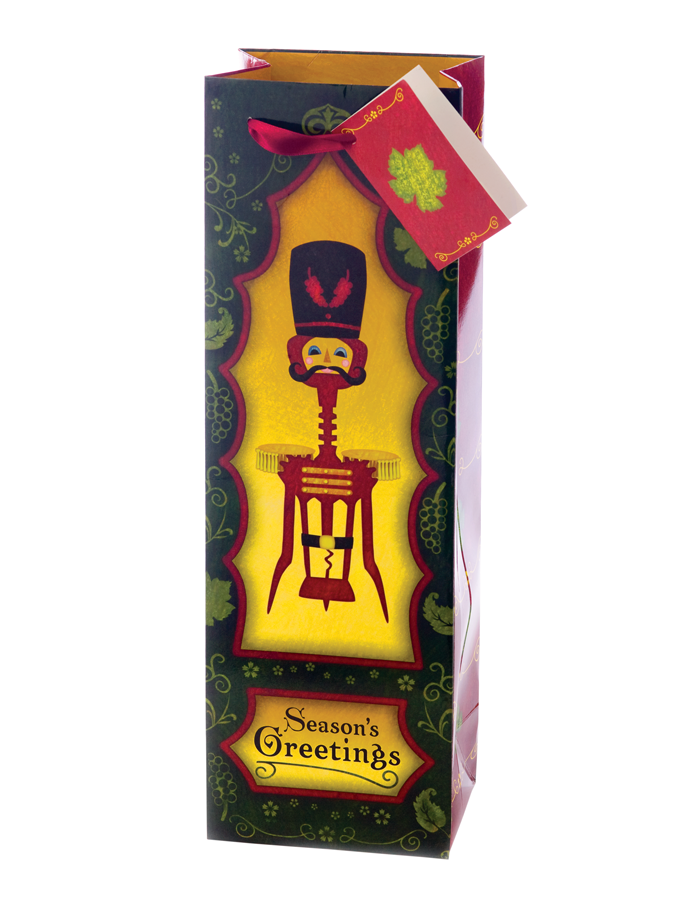
Designed and illustrated paper wine gift bags and catalogs for True Fabrications. It still thrills me to see one of my bags at Whole Foods Market, Cost Plus World Market, or in grocery and wine stores across the United States.
If I were to boil down my design process, it would be to 1.) ask questions and listen, 2.) hierarchy, 3.) inspiration, and 4.) iterate. I ask many questions, but my go-to’s are: What do the people using it care about? What’s the most important thing you need from the product? What are the pain points on the user’s side and the company’s side? The answers to these questions become the problems to solve. Knowing the hierarchy of the most important things focuses the design so I can pull that info to the foreground and get eyes on it.
After receiving my Associate in Applied Science, Graphic Design degree from Des Moines Area Community College (I already had a B.A.), my design career started at True Fabrications, a Seattle-based wholesale wine accessory company. I designed wine bags and three biannual 100+ page printed catalogs filled with thousands of products mailed throughout the United States.
My passion for infographics bubbled up, and I started making them on the side. Between my husband, Cyrus, being an excellent search engine optimizer and my graphics getting online attention, I launched into freelance. I conceptualized and designed infographics for successful marketing campaigns with clients, including eBay, Builtvisible, Moz, Parker LePla, Printer Inks, and Digital Third Coast.
My experience led to work at MSN.com, where I designed weekly infographics and social media assets for publication on multiple MSN.com channels, including MSNnow, Entertainment, Causes, Money, Healthy Living, and Weather.
While waiting in line at Cinerama (the best movie theater in Seattle), I learned about the Institute for Health Metrics and Evaluation (IHME). I stalked their website, and months later, they were hiring a graphic designer, where I applied and got the job. IHME, at the University of Washington, collaborates globally to collect health data to inform policy and improve health. I worked on the communications team to help share the findings with a general audience. There I designed health-related infographics, policy reports, and marketing materials for use in countries worldwide. Collaborators included GAVI, Gates Foundation, PATH, the Inter-American Development Bank, and Salud Mesoamérica. I was also cited as an author in The Journal of the American Medical Association (JAMA) for six published infographics.
Around this time, I left IHME, and Cyrus and I started Zyppy.com, an SEO education and consultation site. We designed the 100+ Google Ranking Factors for SEO Success and several viral graphics and articles.
I received an inquiry email from Santorini Dave to design a Seattle map. My love of maps was blooming, and I took the job. When completed, he offered me the adventure of a lifetime. Would I be interested in making 100 maps of Santorini, Greece, including traveling there to find the locations of hotels, restaurants, and attractions lining the caldera cliffs? Absolutely. After completing the project, I joined the Santorini Dave team in 2019. I designed travel maps with them until May 2025.
In March 2025, Cyrus and I launched Zyppy List, a free, human-reviewed top-tier marketing directory where I designed the website’s look and logo and collaborated on the UX.