
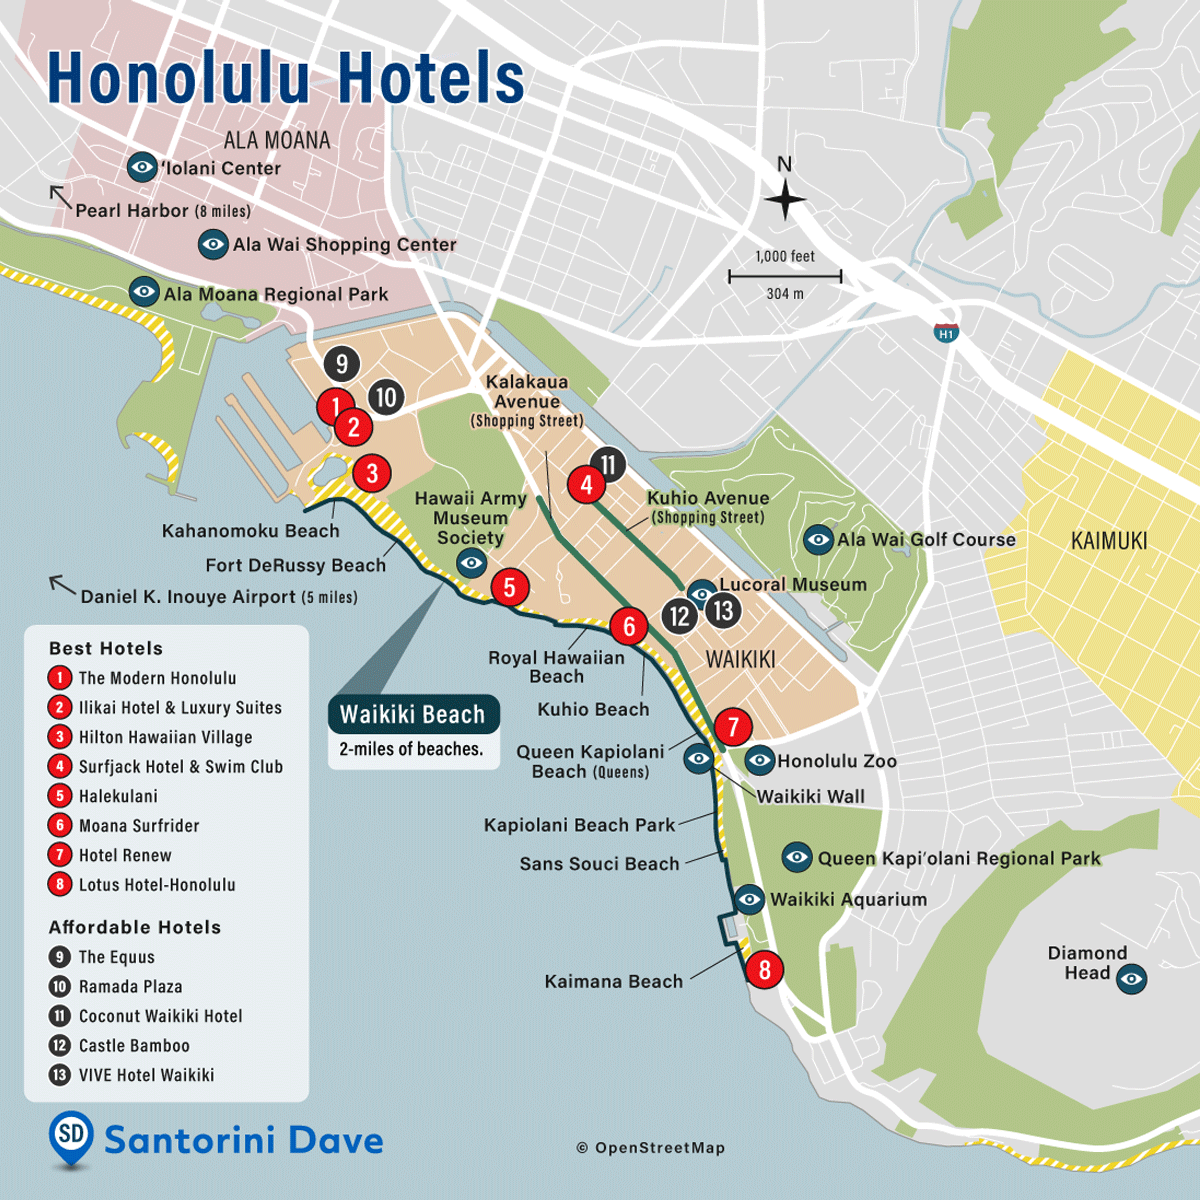
Santorini Dave: Hundreds of Travel Maps
Digital: Map Illustration, Layout
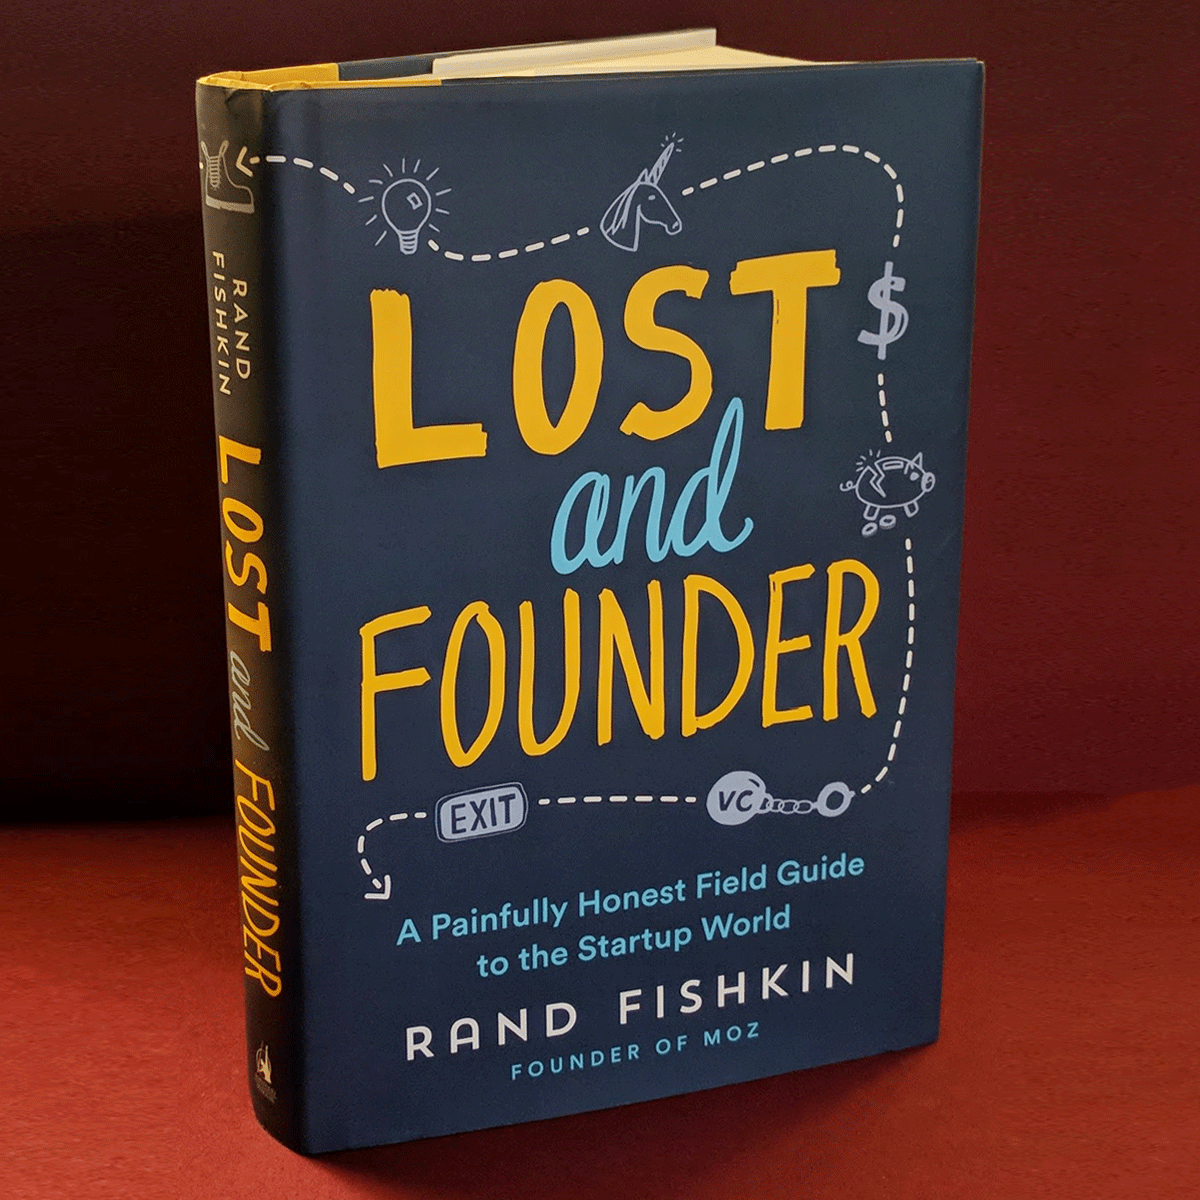
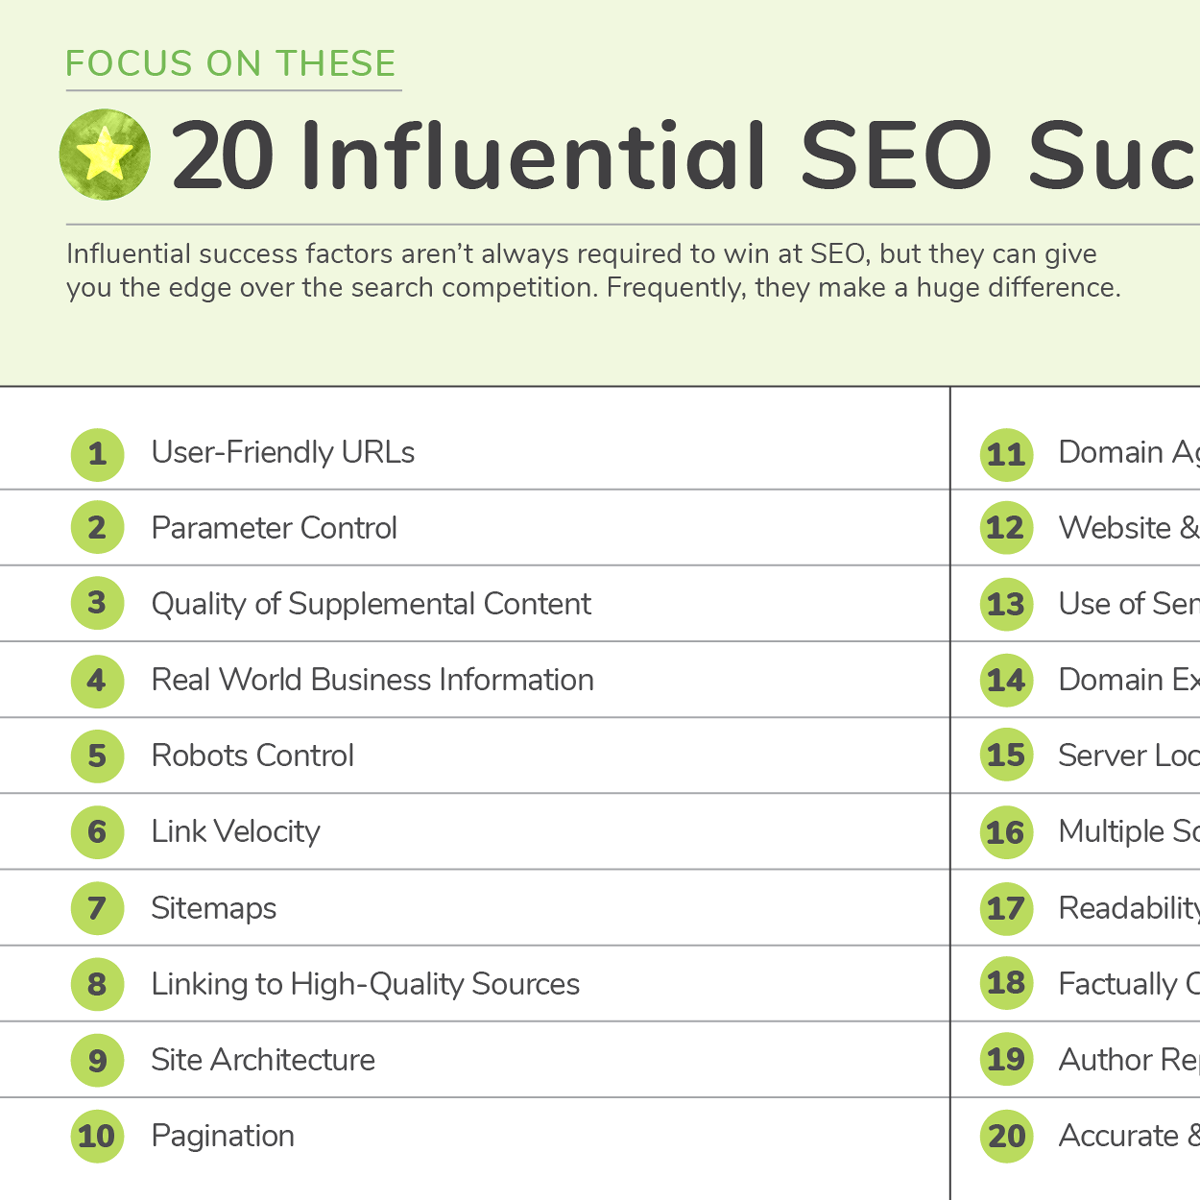
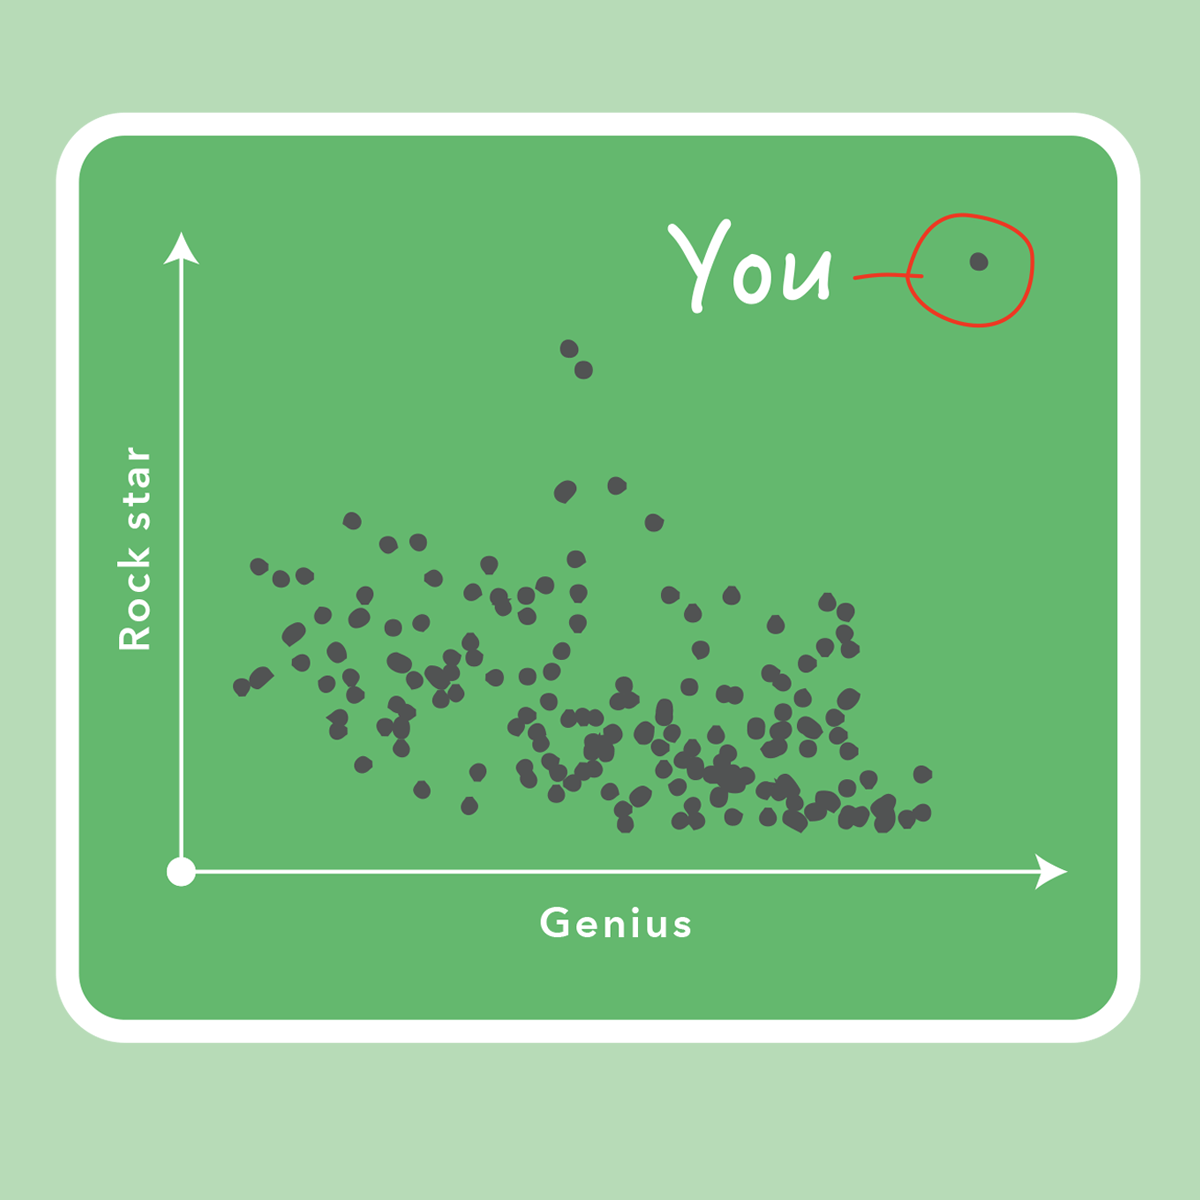
Rand Fishkin: Book Cover Design & Inside Charts
Digital: Concept, Illustration, Layout, Charts, Hand Lettering
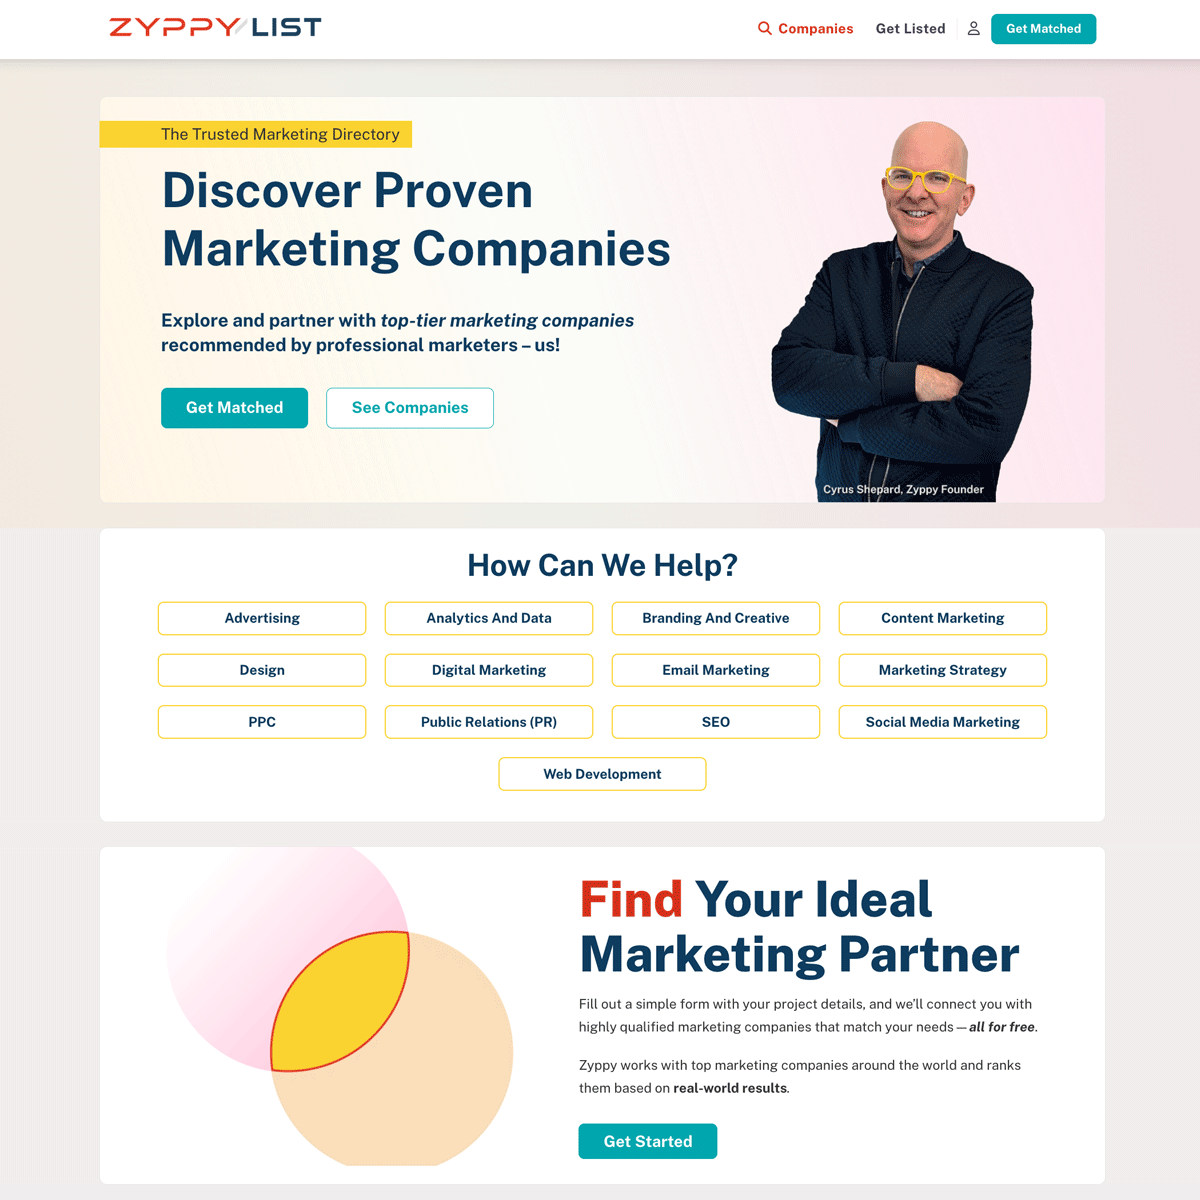
Zyppy List: Website Design
Digital: Layout, Design, UX, Branding
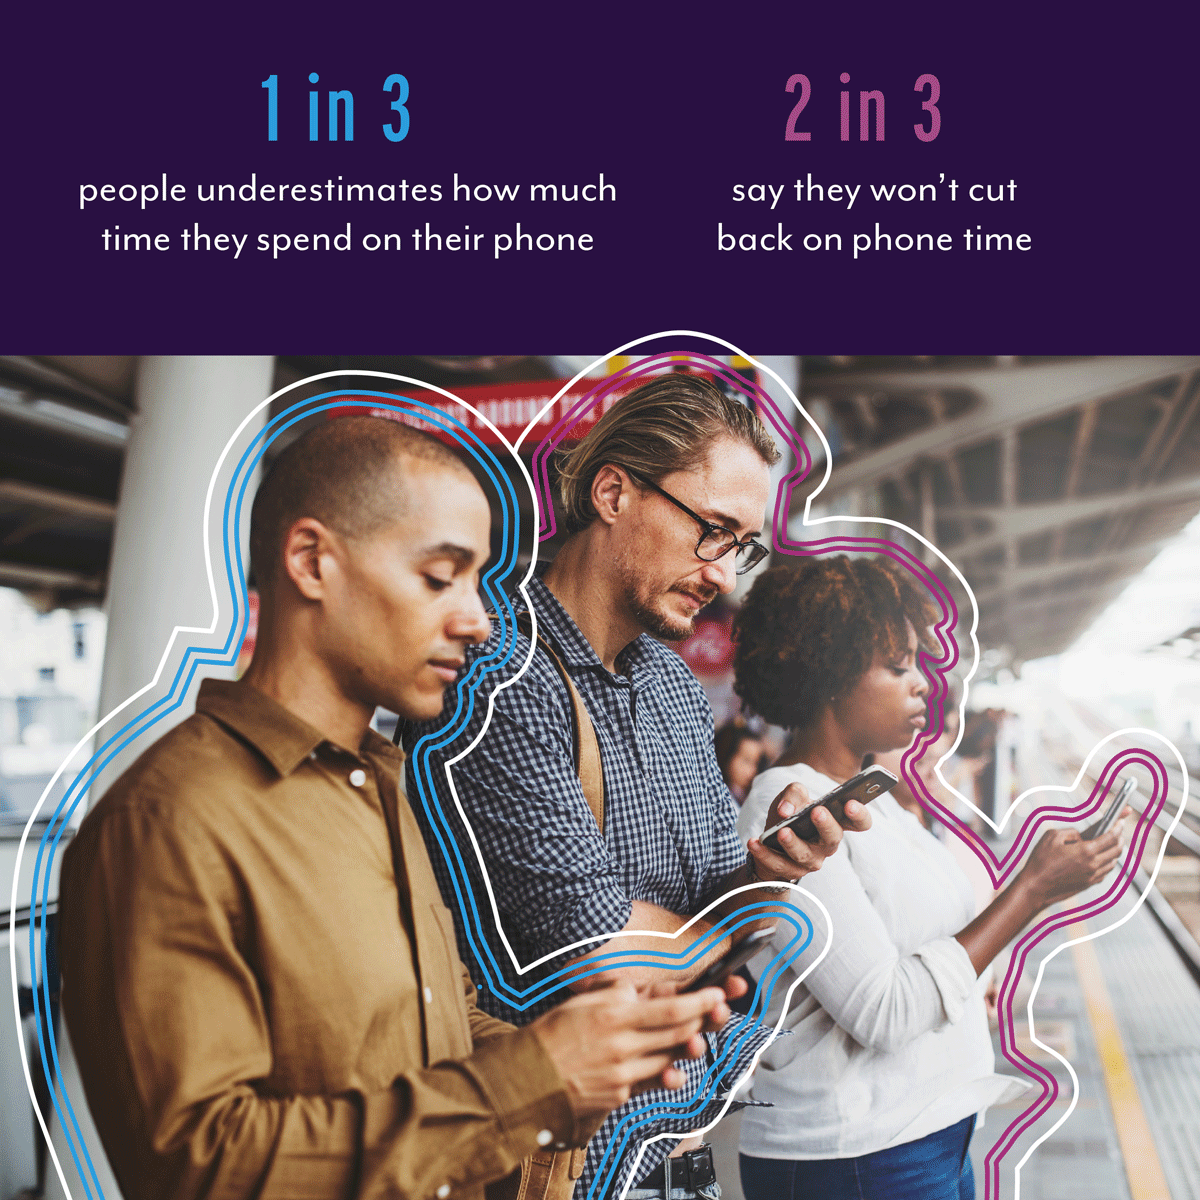
Digital Third Coast: Smart Phone Use Infographic
Digital: Layout & Design, Illustration
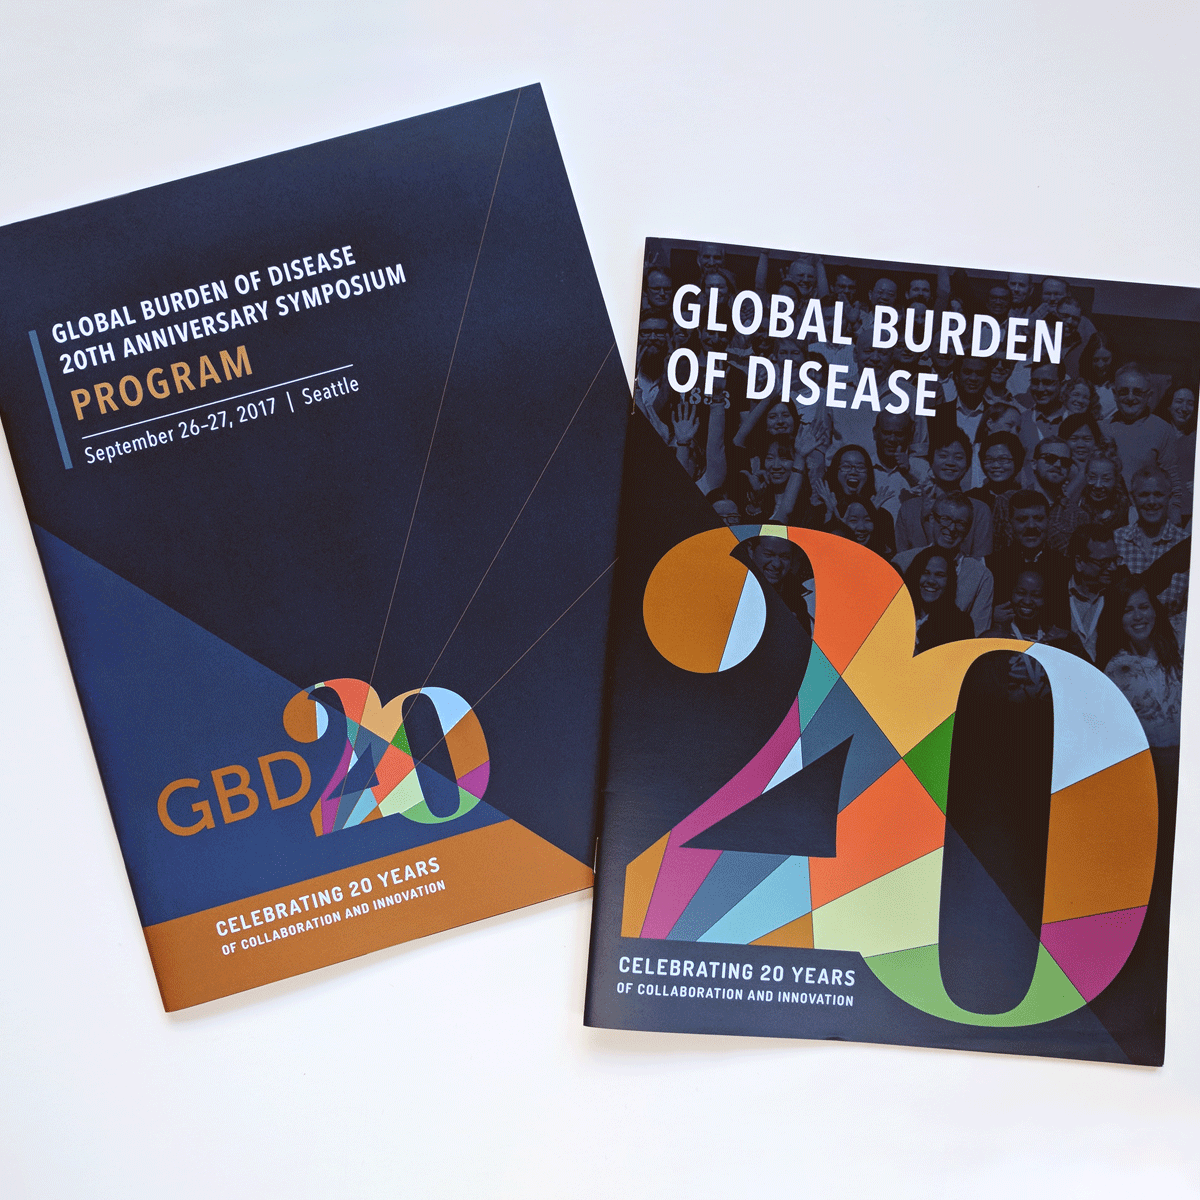
IHME: GBD 20th Anniversary Program & Magazine
Print: Concept, Layout & Design, Photo Editing, Branding
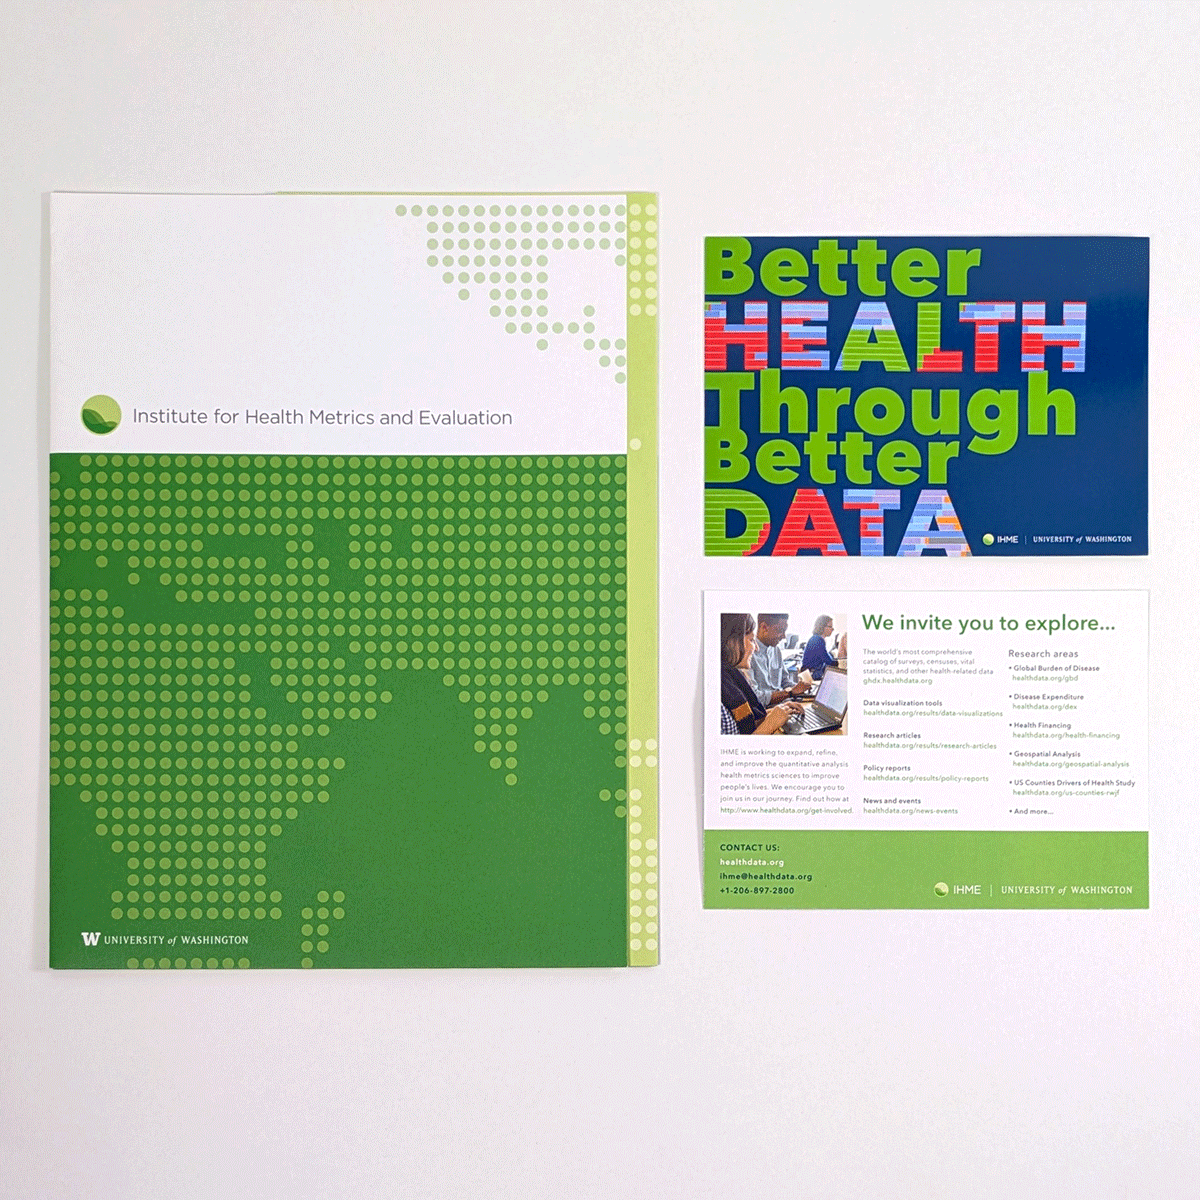
IHME: IHME Branded Folder & Post Card
Print: Concept, Layout & Design, Photo Editing, Branding
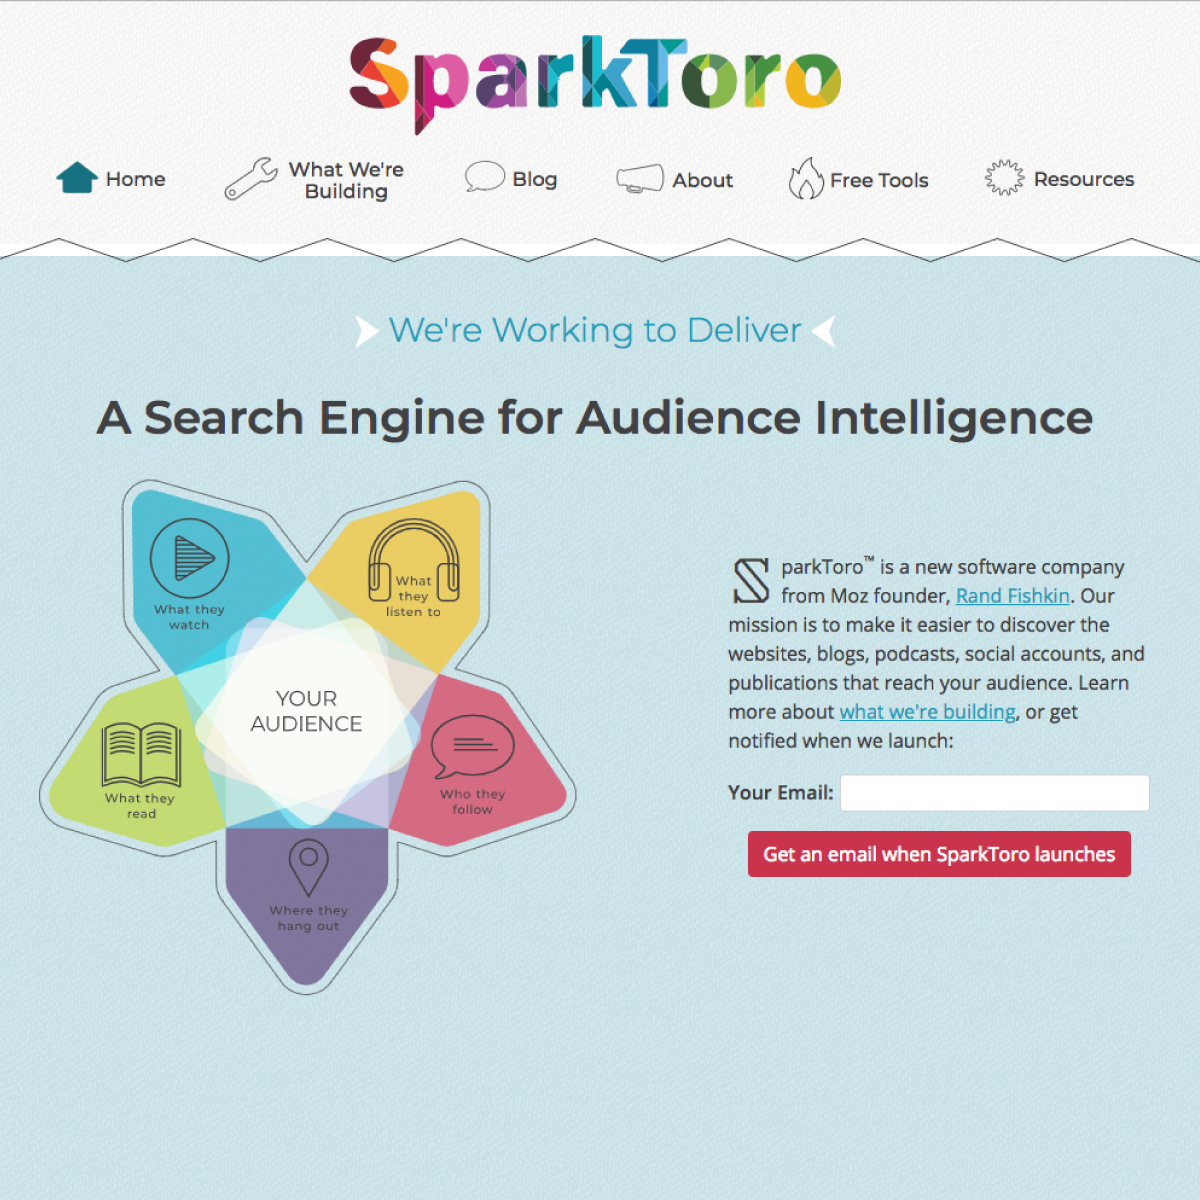
SparkToro: Branding & SparkToro Web Design
Digtial: Web Design, Branding
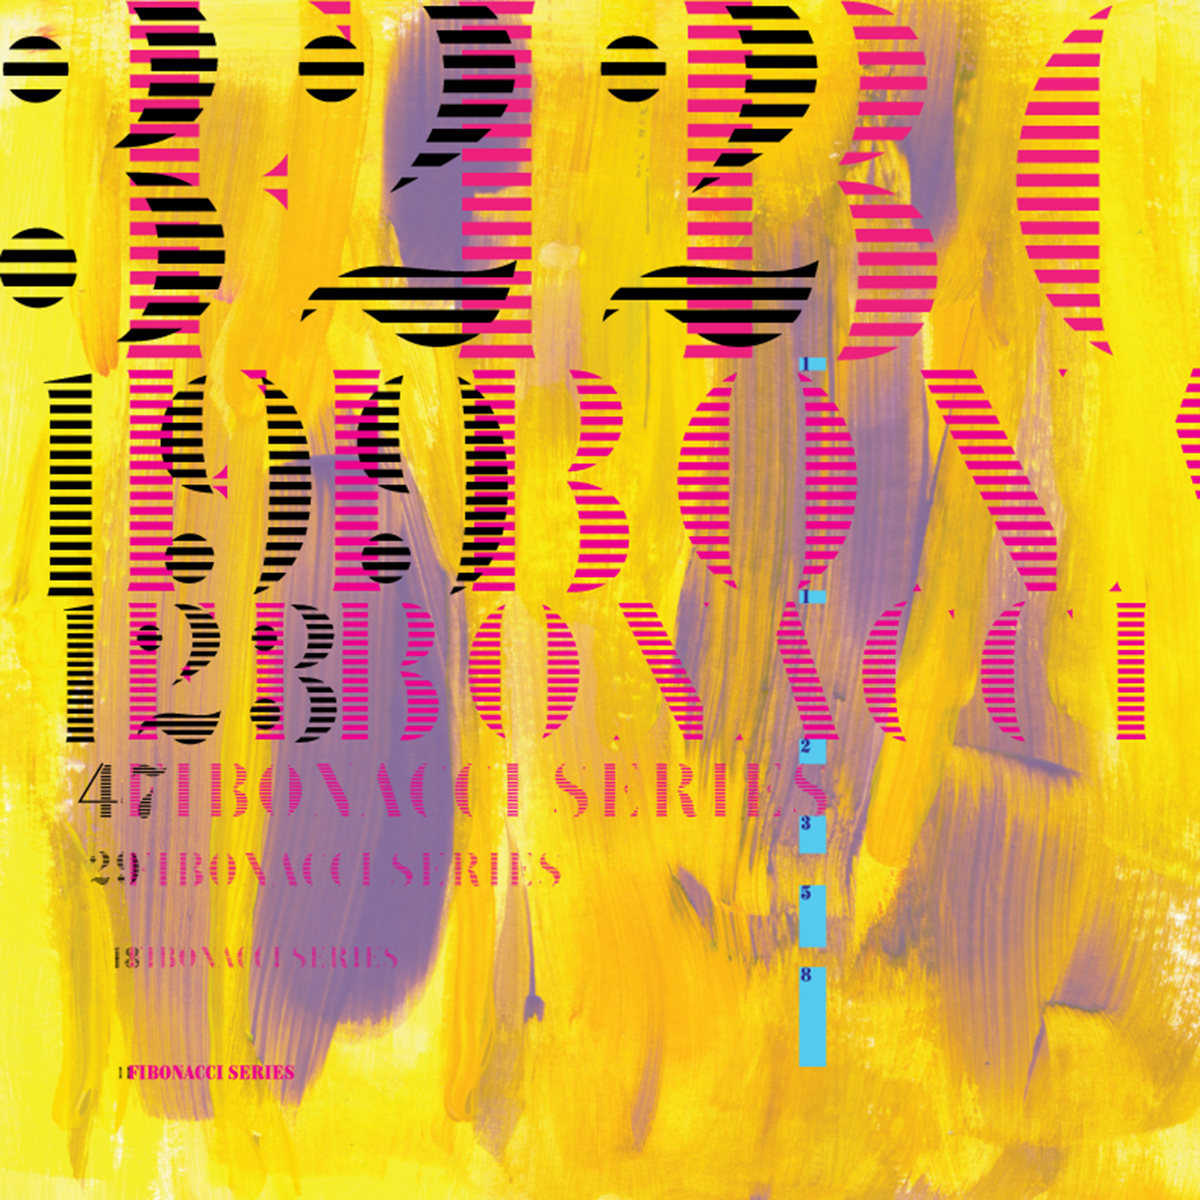
Personal: Experimenting with the Fibonacci Series
Digital: Painting, Type, Color
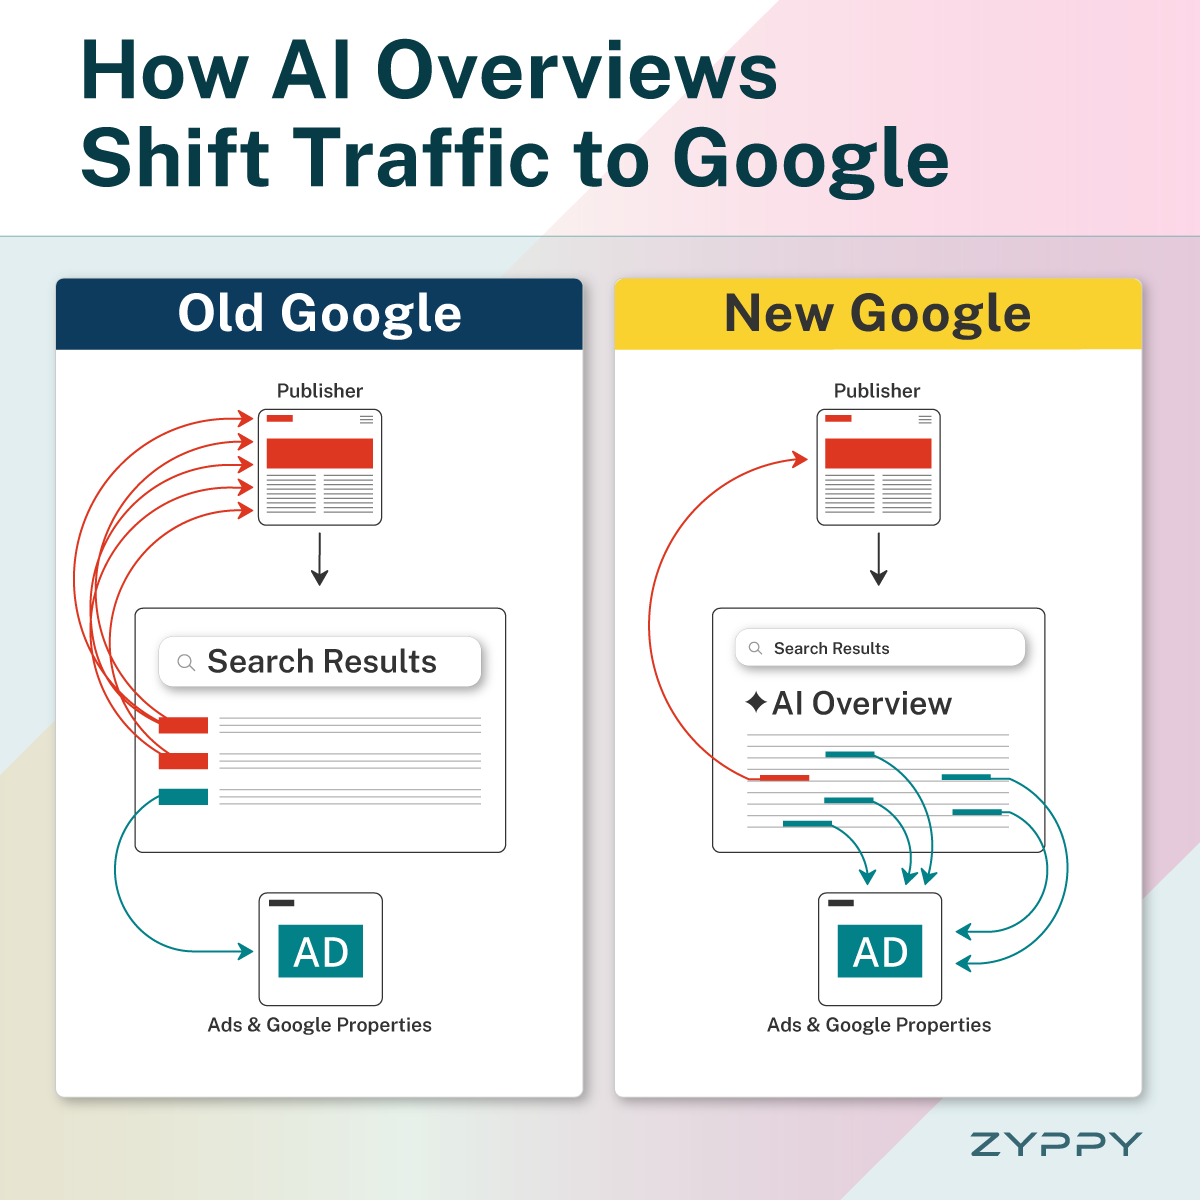
Zyppy List: Article & Social Media Graphic
Digital: Infographic, Layout, Design
Zyppy: Branding & Educational Content
Digtial: Layout & Design, Branding
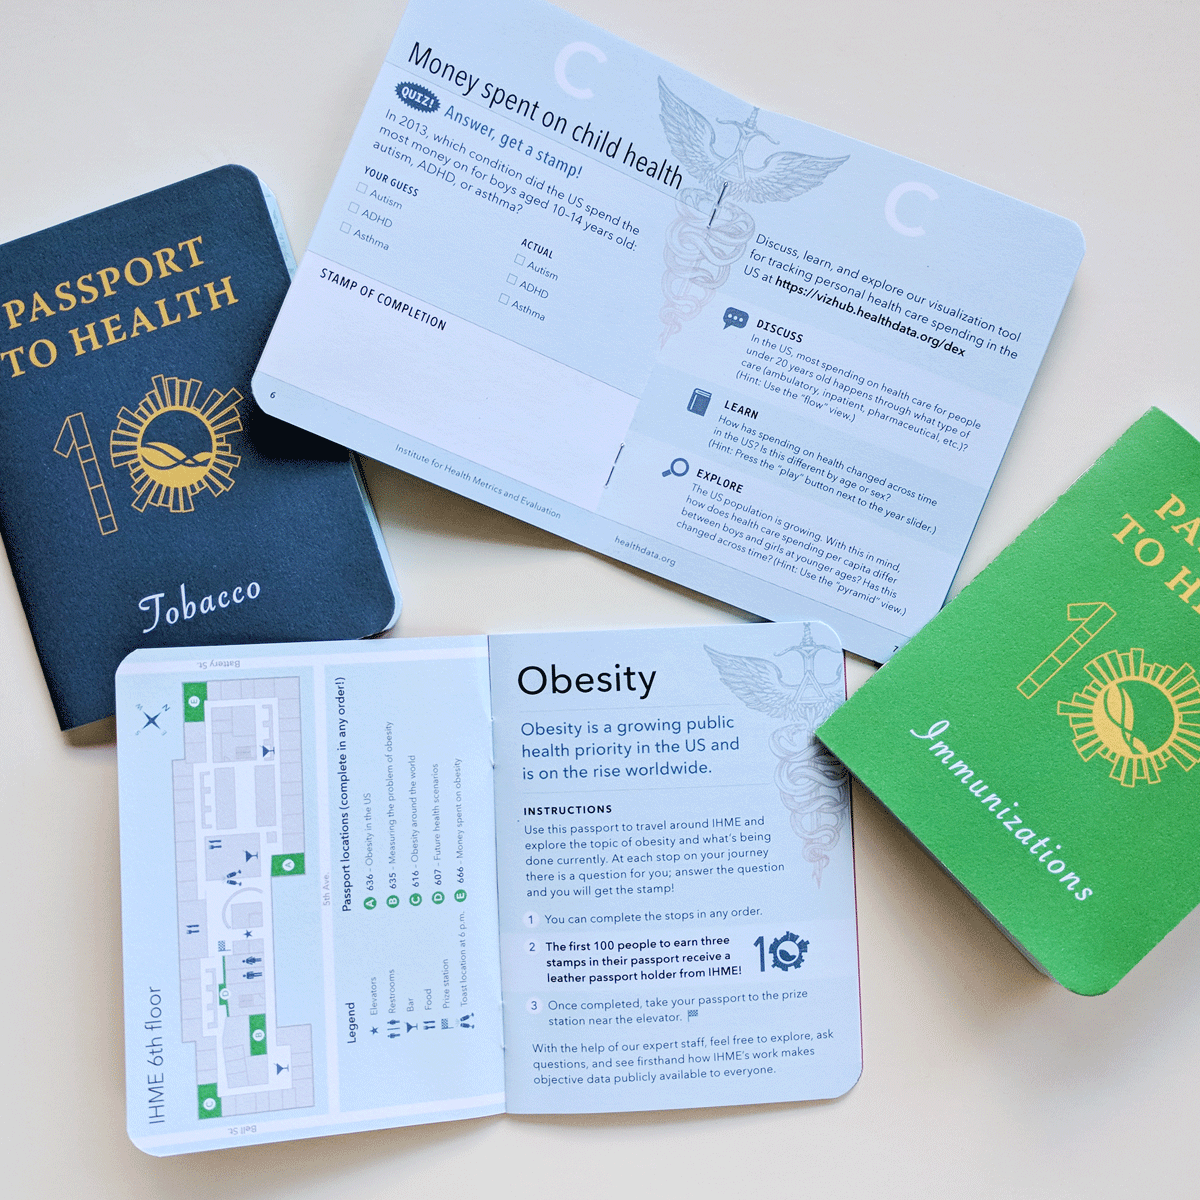
IHME: 10-Year Anniversary Passport Game
Print: Layout & Design, Map

Personal: Limoncello Label
Print: Photo Editing, Branding, Painting, Hand Lettering
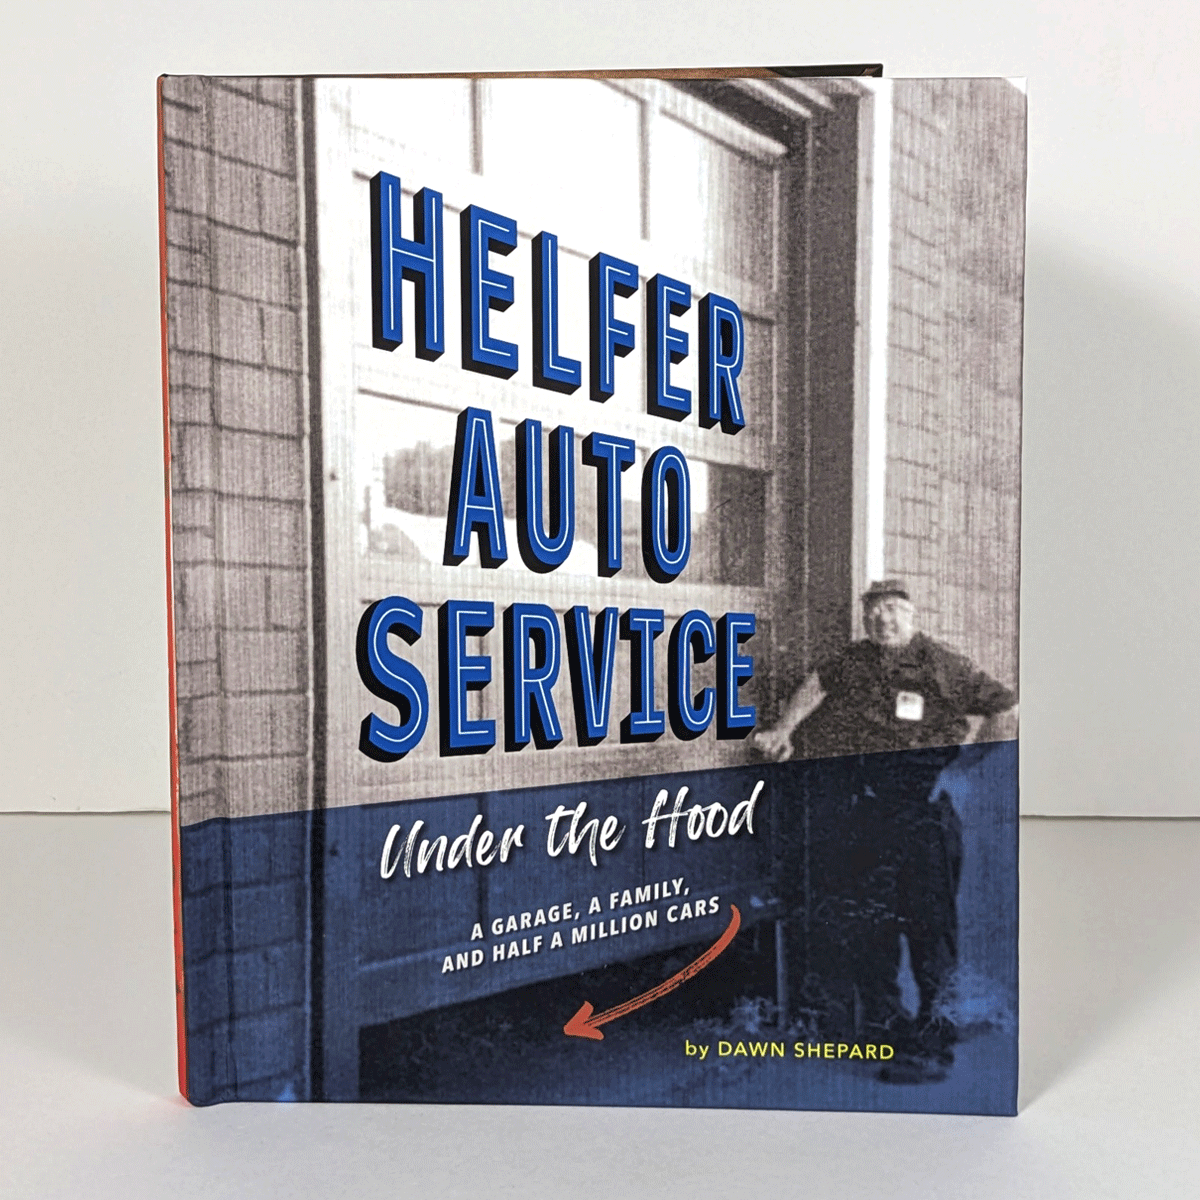
Personal: Family Business Memoir
Print: Layout, Design, Photo Editing, Writing, Print Prep
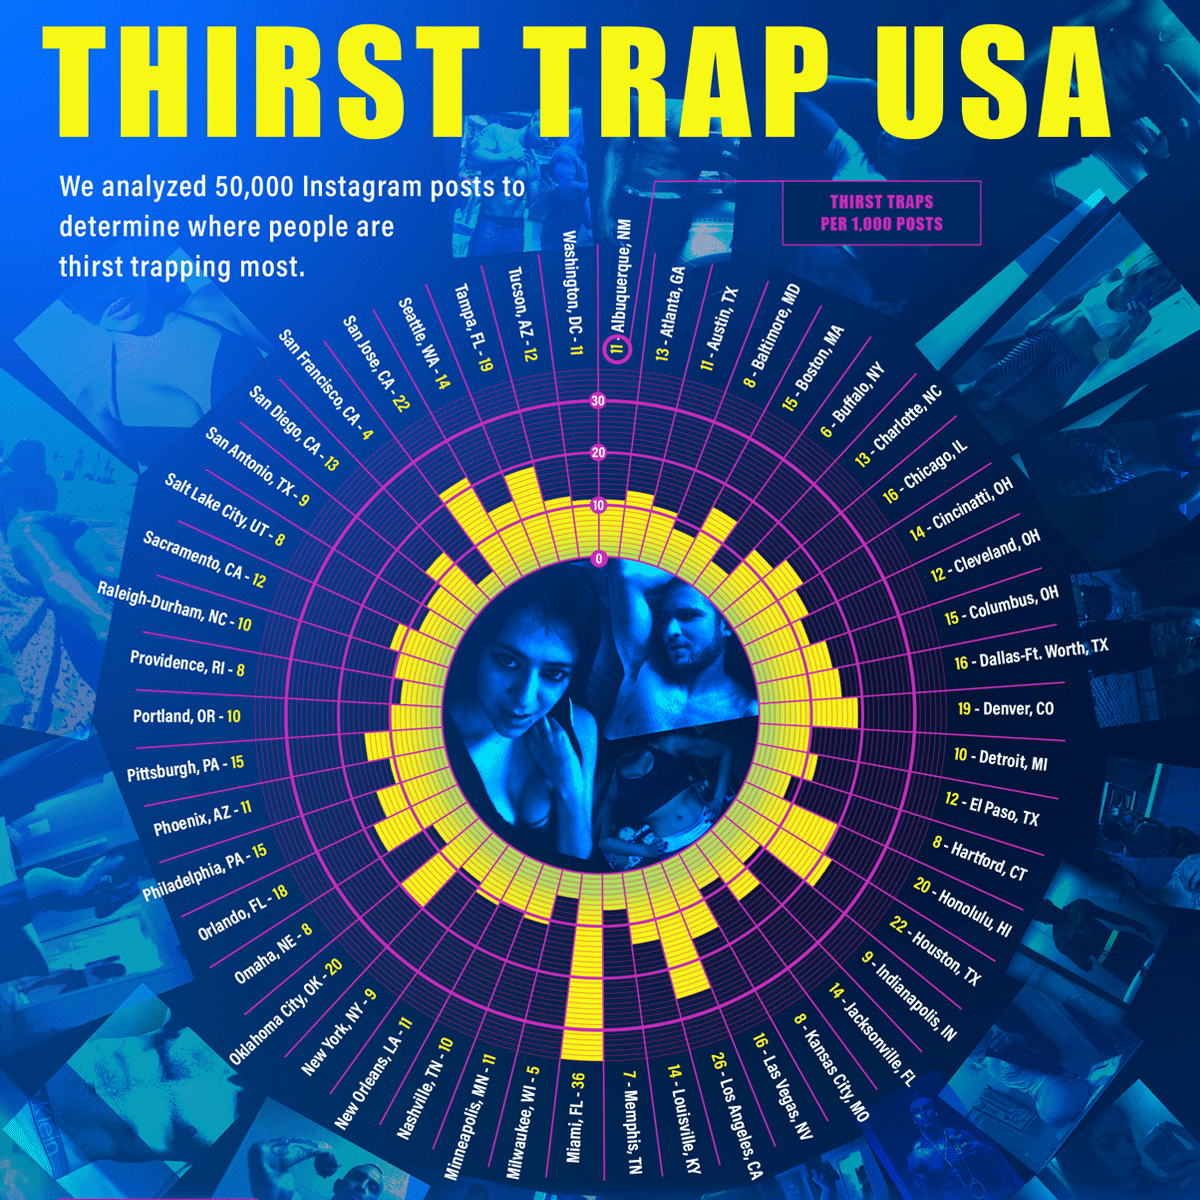
Digital Third Coast: Thirst Trap Infographic
Digital: Concept, Layout, Design, Data Visualization
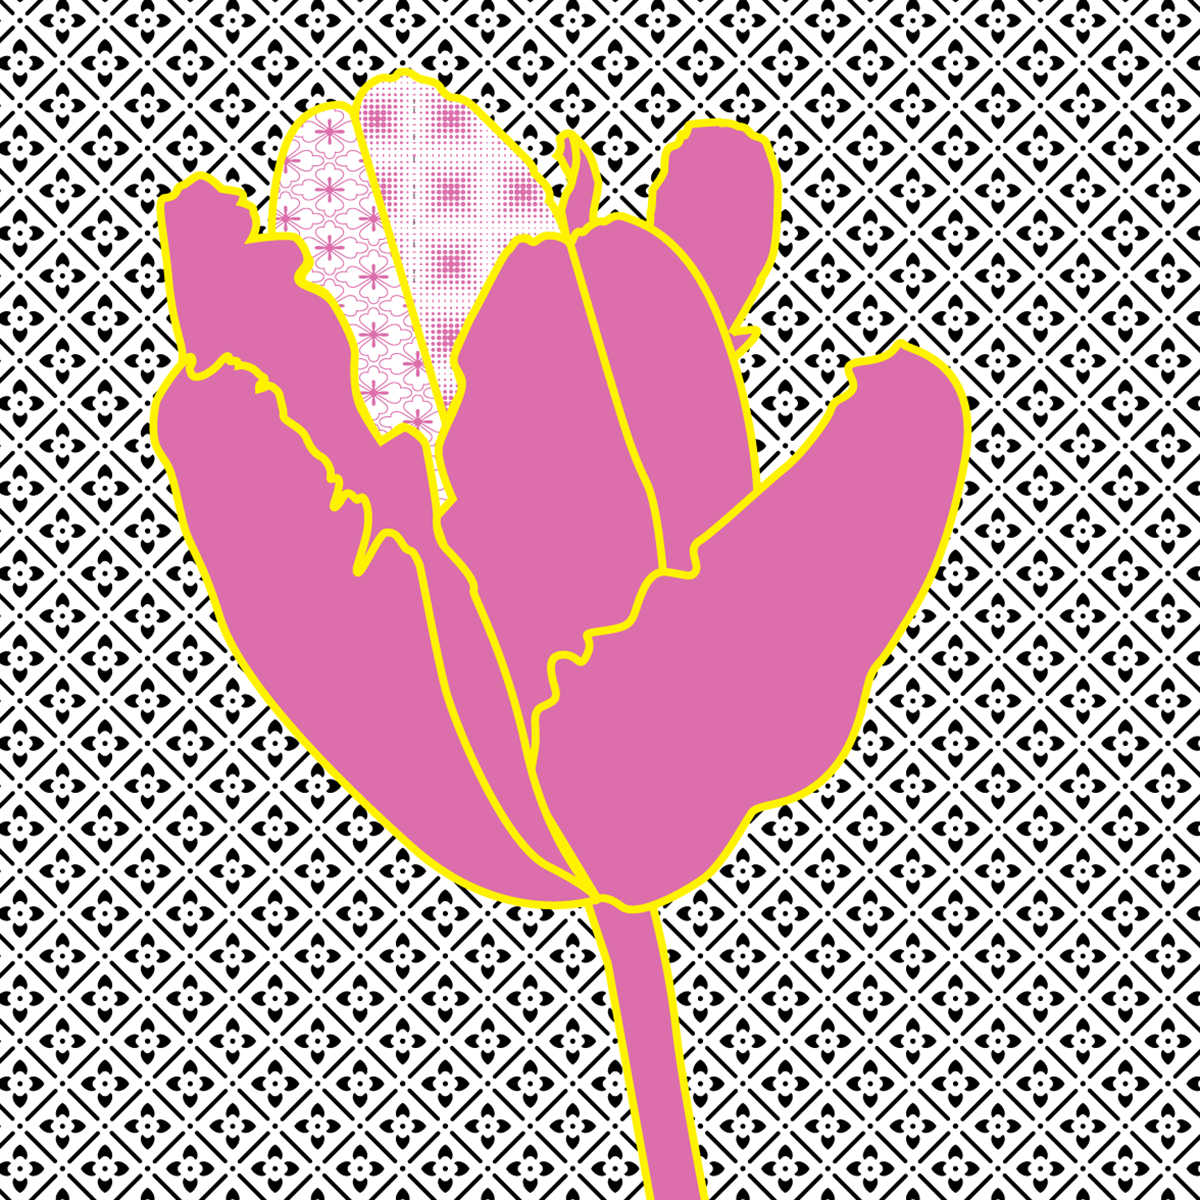
Personal: Digital Tulip Illustration
Digital: Illustration, Pattern
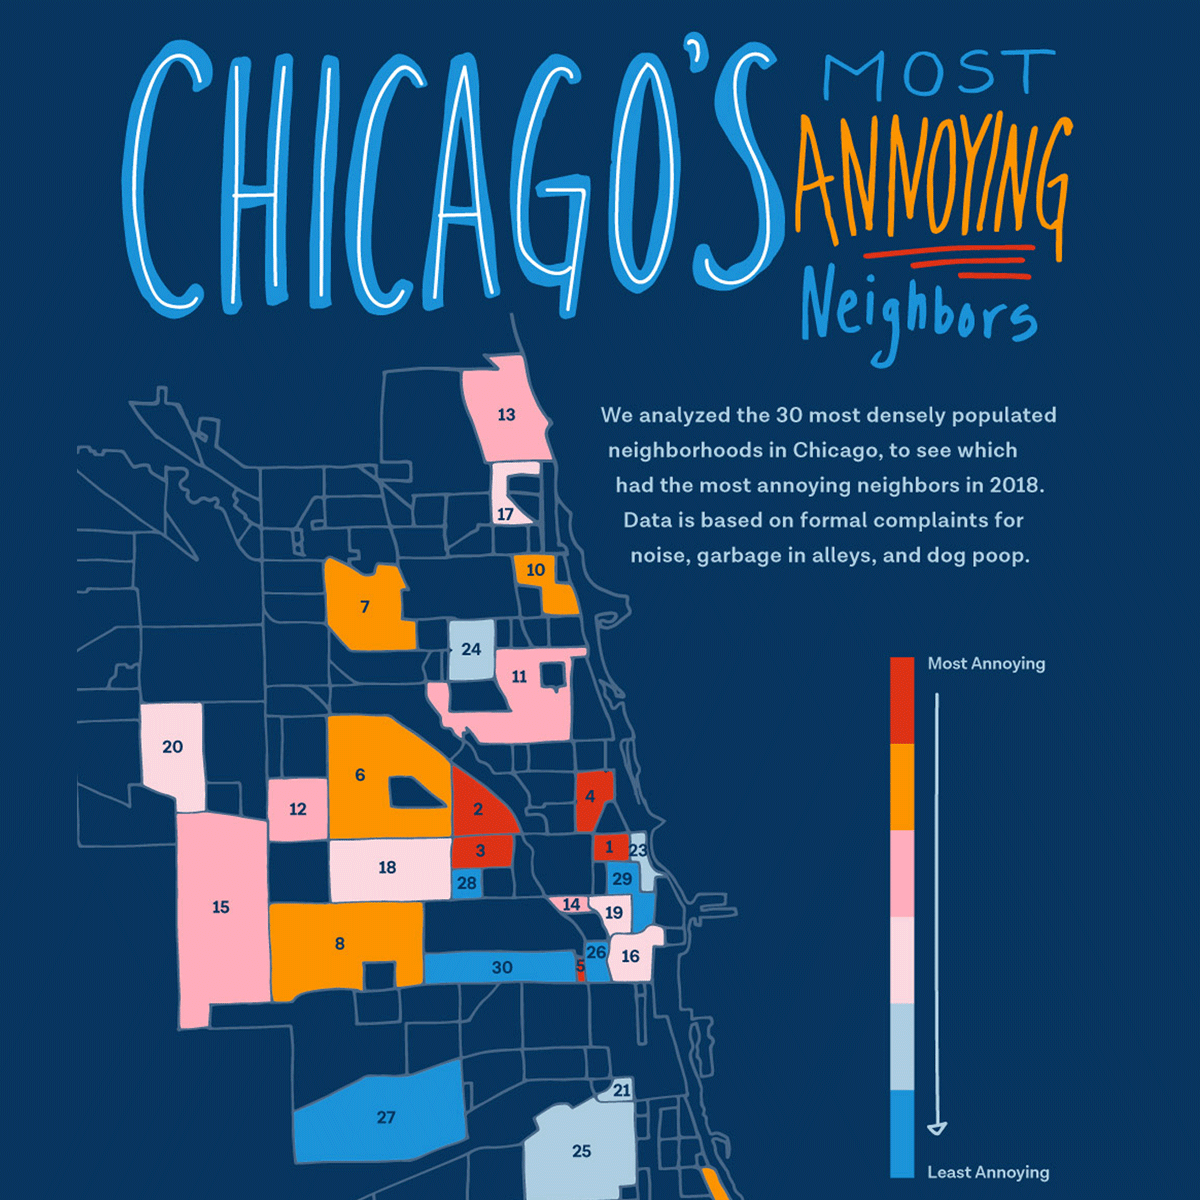
Digital Third Coast: Chicago Map Infographic
Digital: Map Illustration, Layout & Design, Hand Lettering
IHME: Staff Greeting Cards
Print: Concept, Illustration, Design
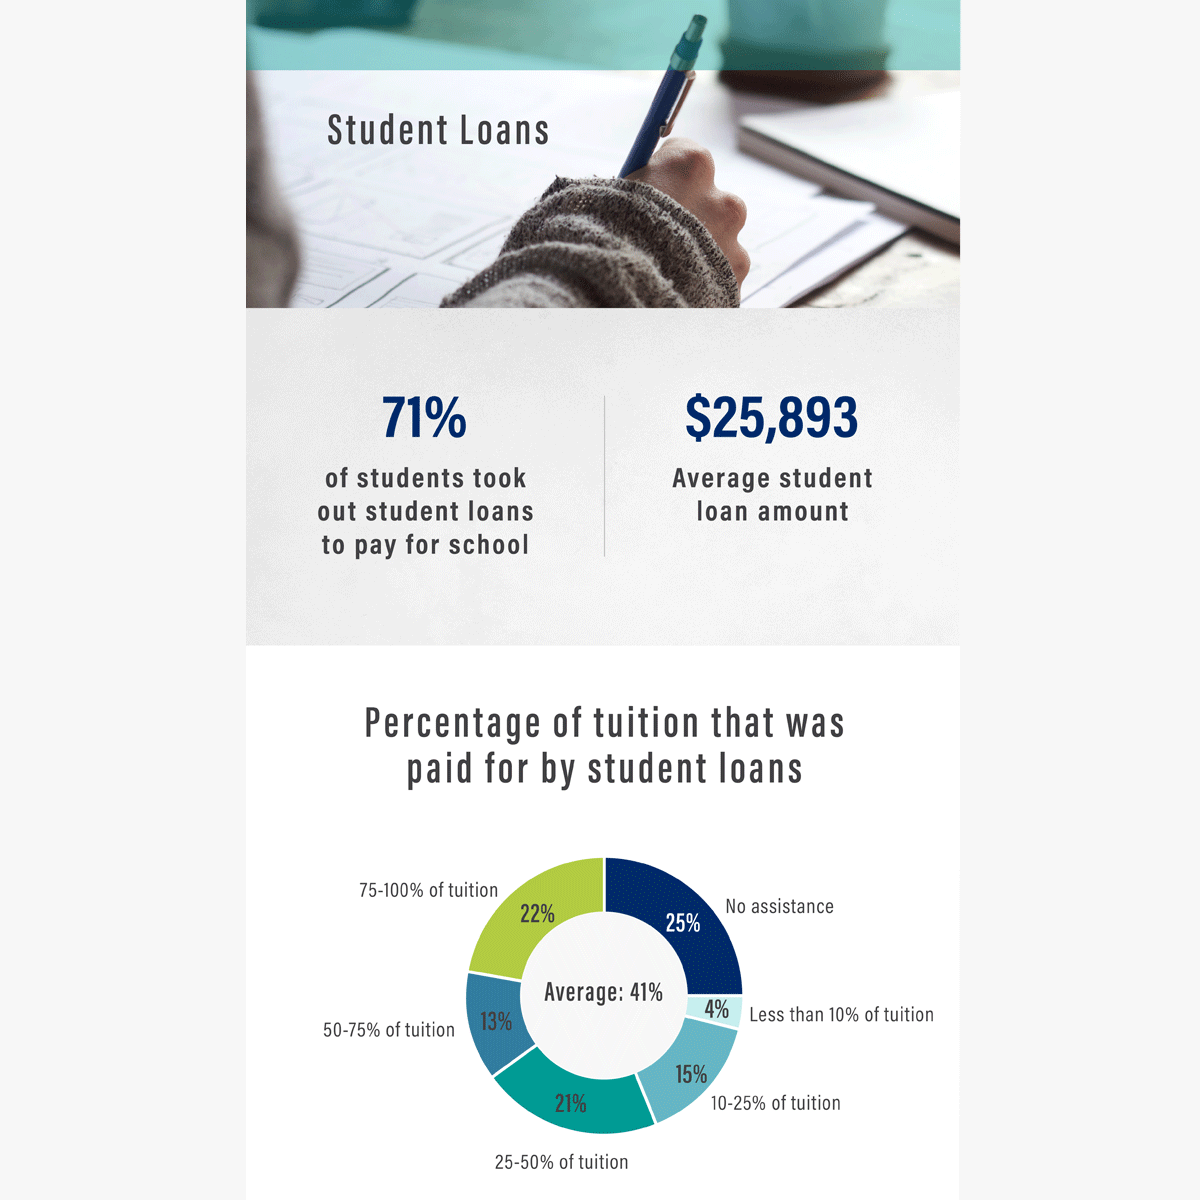
Digital Third Coast: College Infographic
Digital: Layout & Design
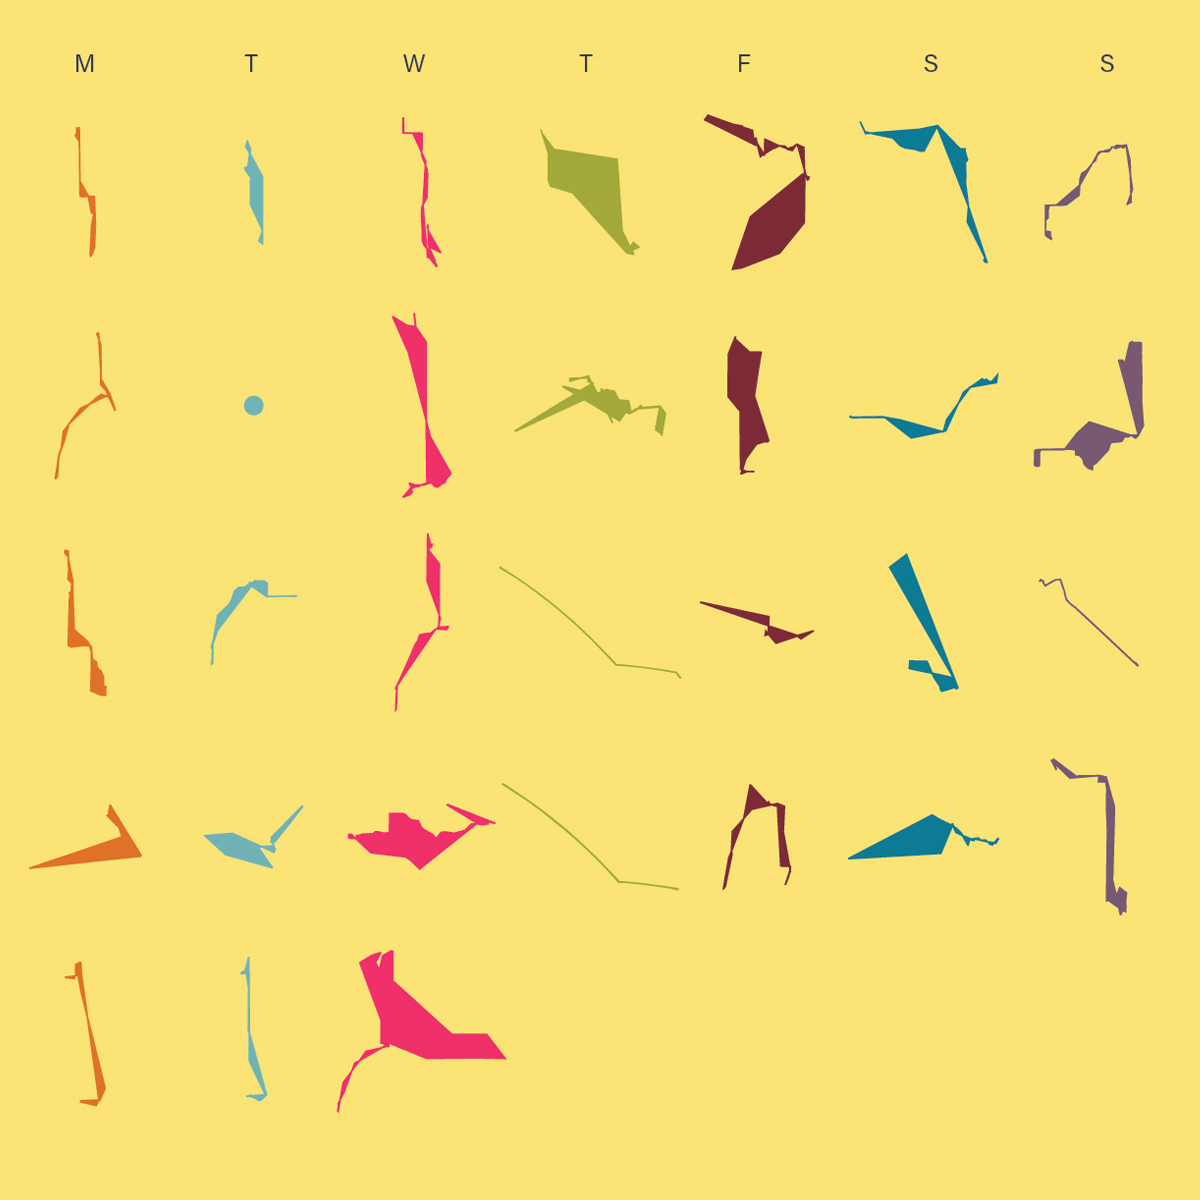
Personal: The Shapes I Make Walking
Digital: Concept, Layout & Design, Data Visualization
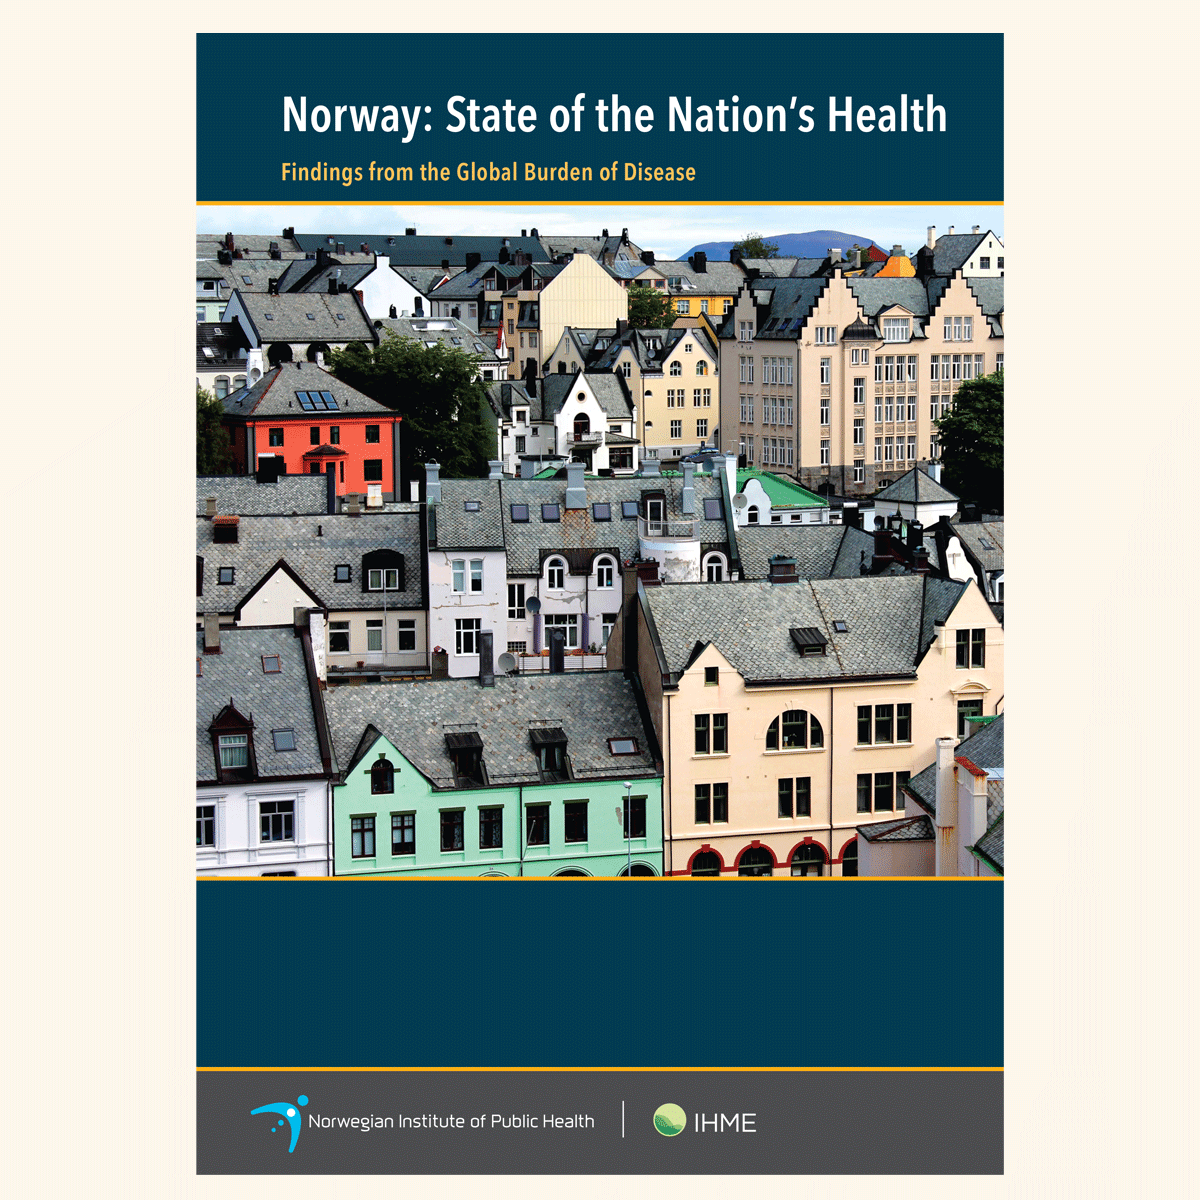
IHME: Norway Report & Other Reports
Print: Layout & Design, Data Visualization
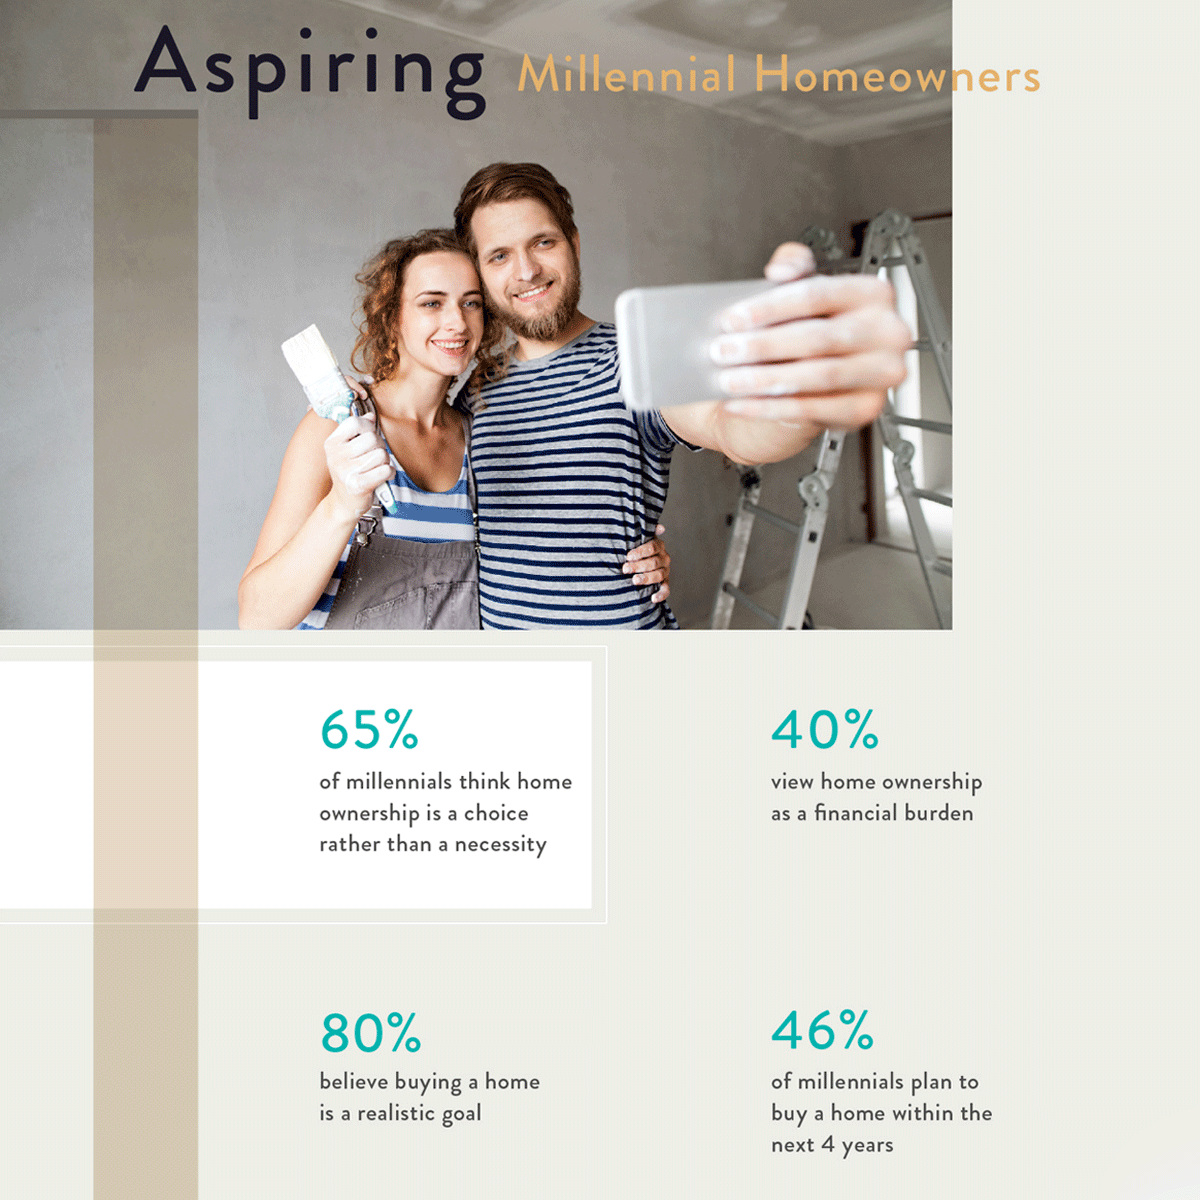
Digital Third Coast: First Time Home Buyers Infographic
Digital: Layout & Design, Data Visualization

IHME: Roux Prize Post Card & Infographics
Print: Layout & Design
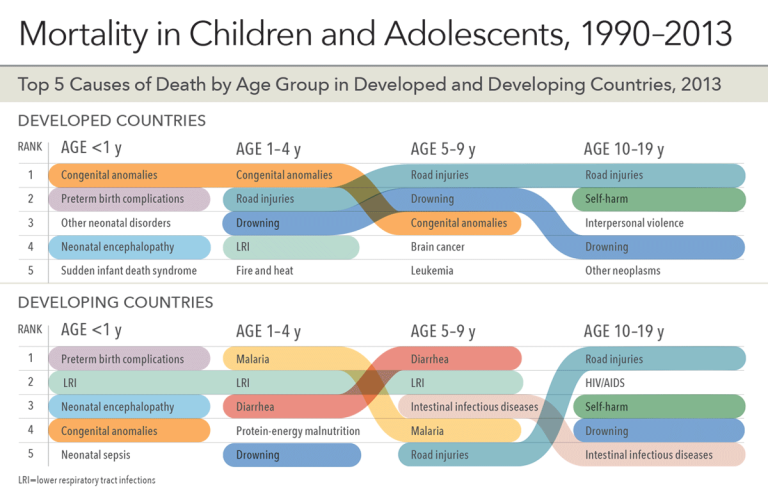
IHME: JAMA - 6 Infographics
Print: Layout & Design, Data Visualization

IHME: IHME Social Media Animated GIF
Print: Layout & Design, Story, Animation, Data Visualization
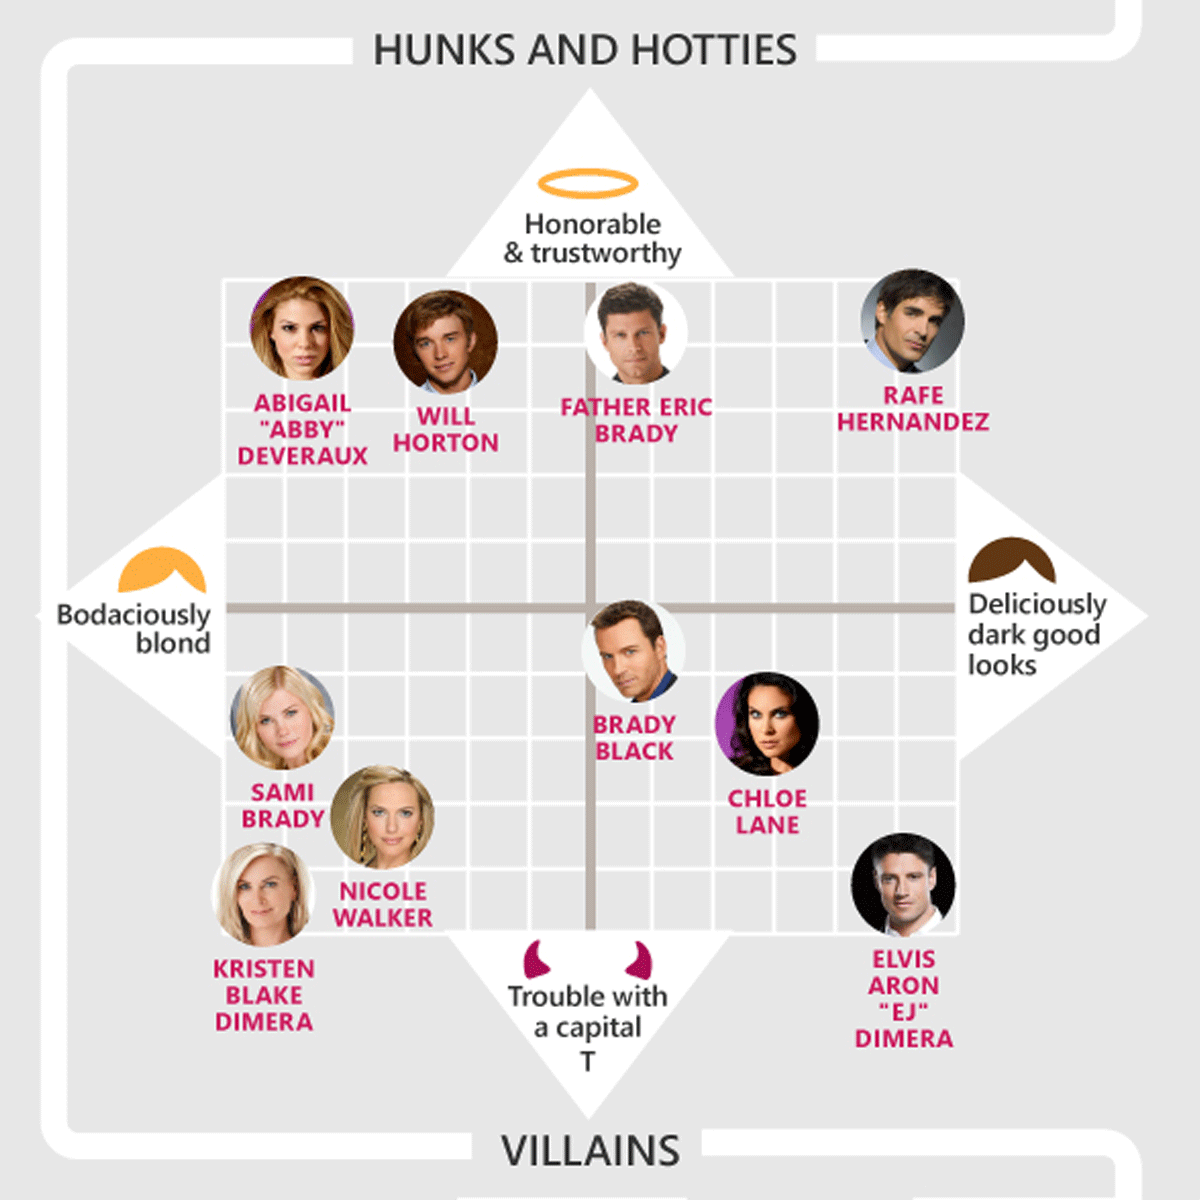
MSN: Soap Opera Infographic
Digital: Layout & Design, Data Visualization, Illustration

Personal: Illustrated Map Memoir
Digital: Map Illustration, Layout & Design, Hand Lettering
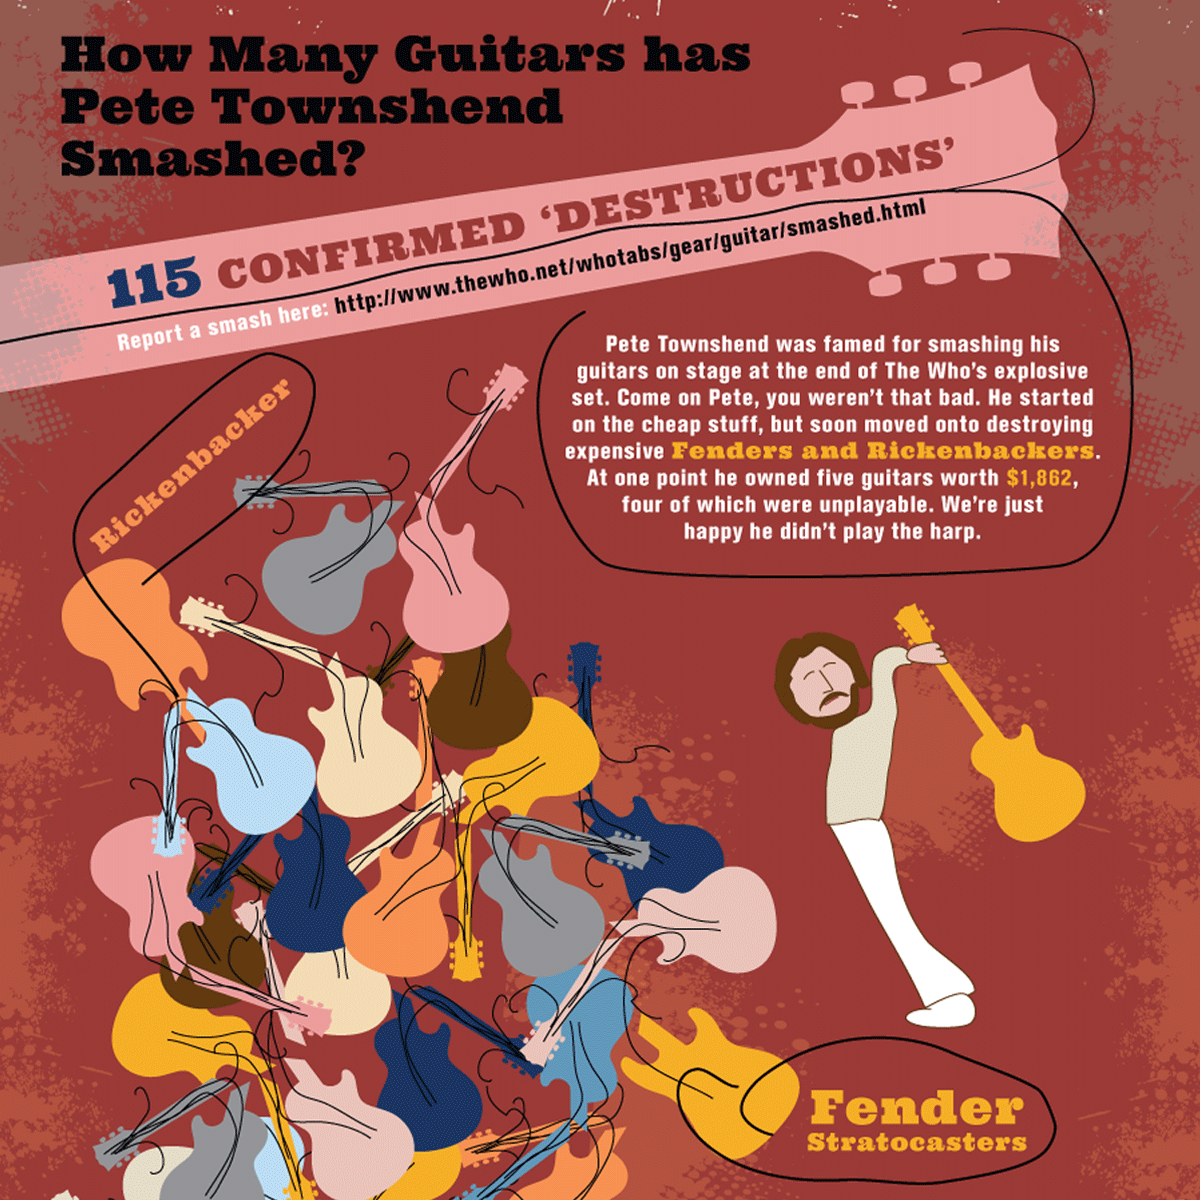
Builtvisible: Rock-n- Roll Infographic
Digital: Illustration, Layout & Design
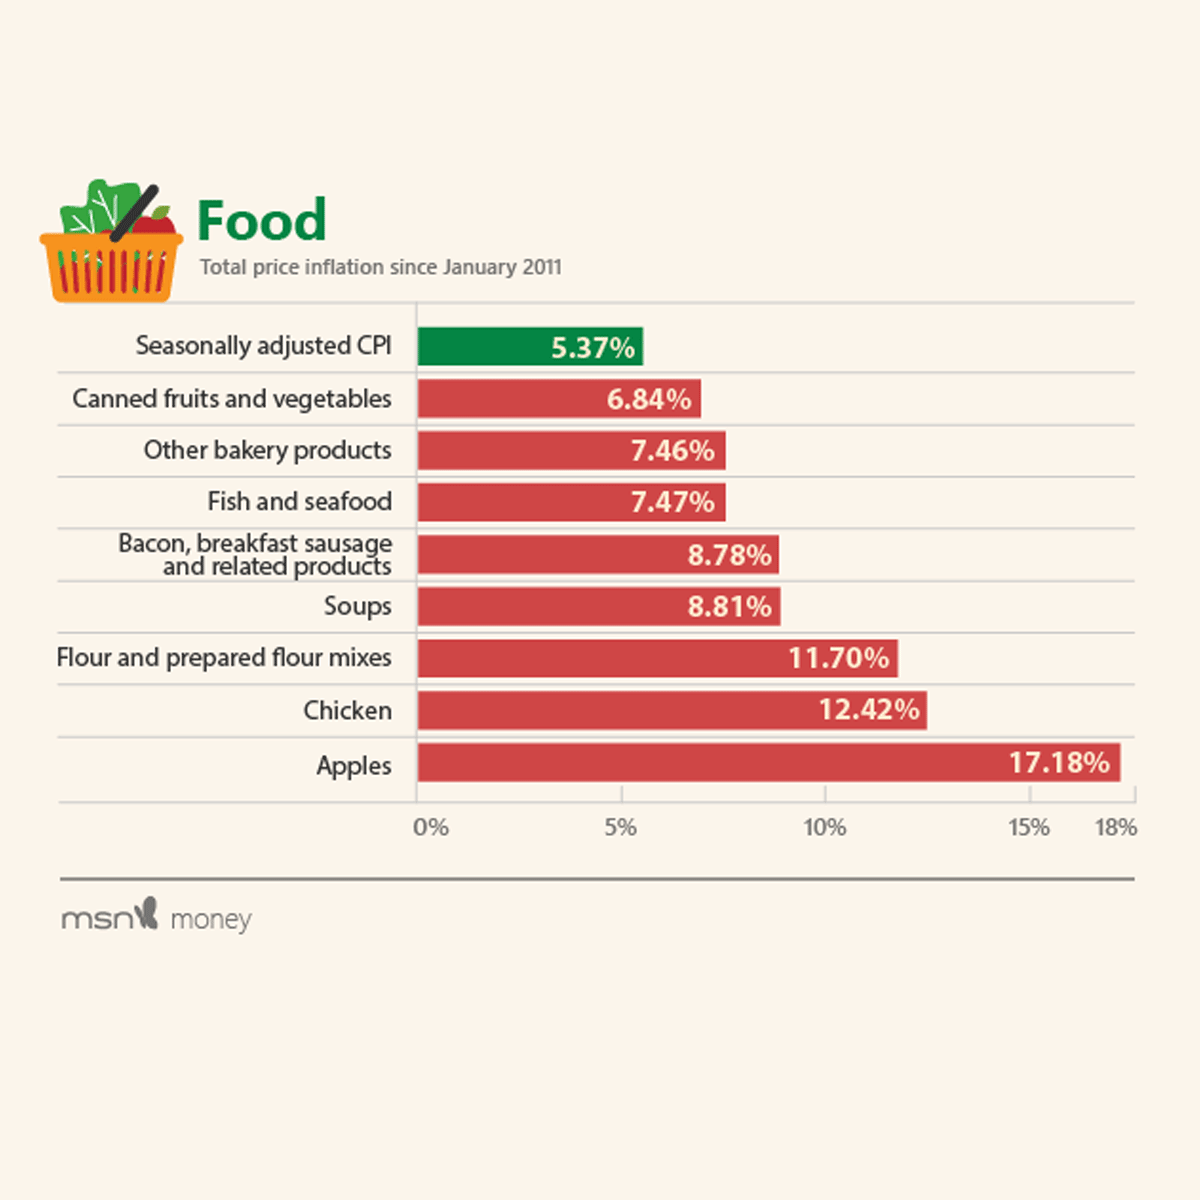
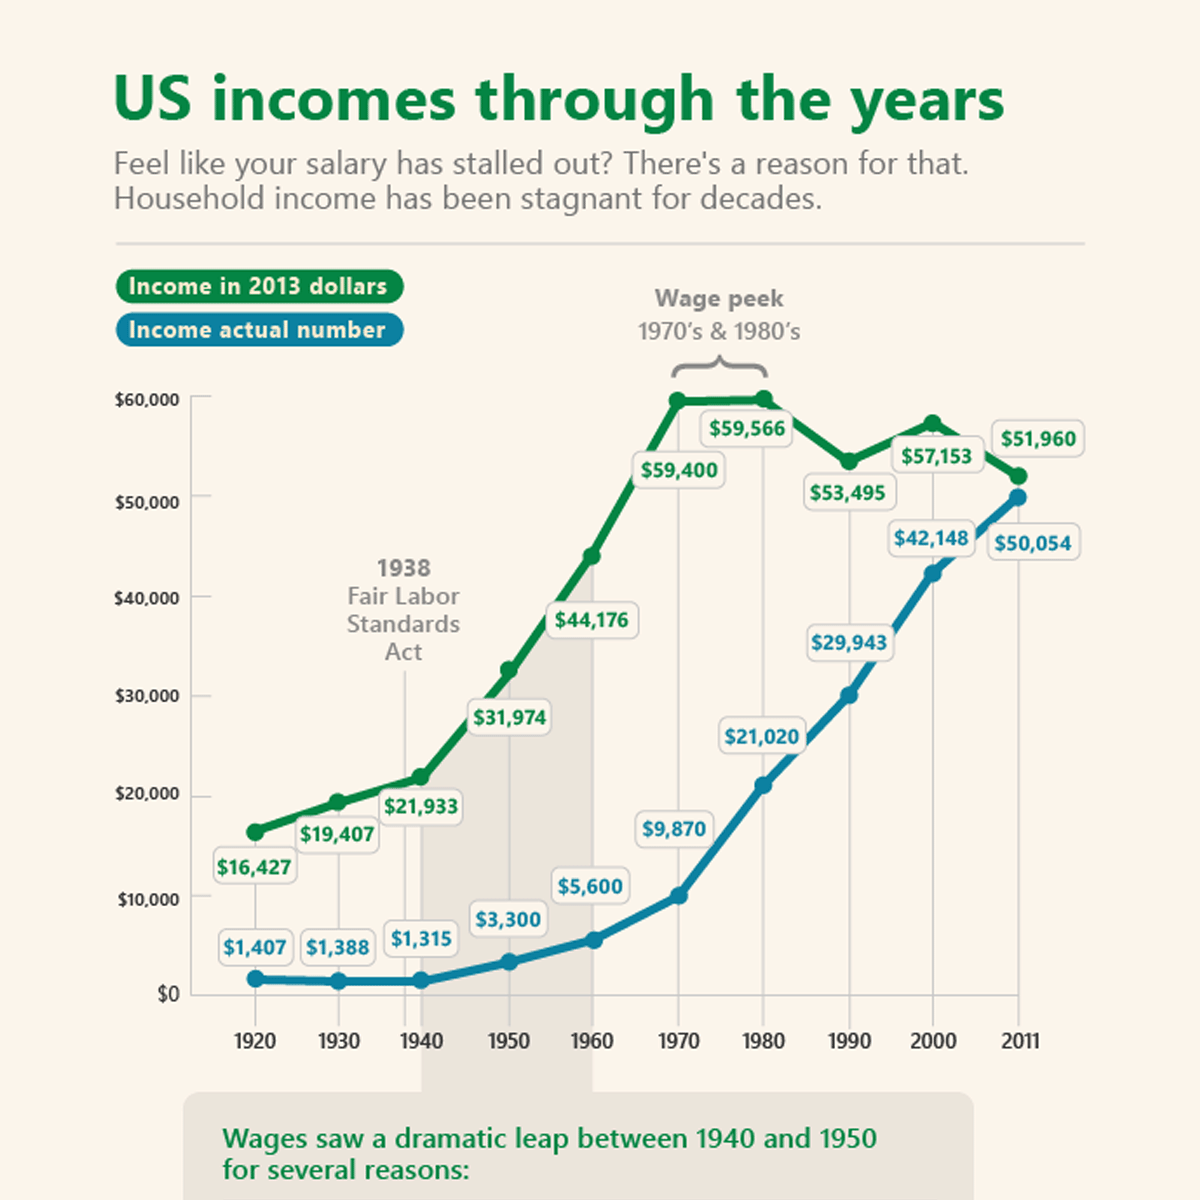
MSN Money: Inflation Infographic
Digital: Layout & Design, Data Visualization, Illustration
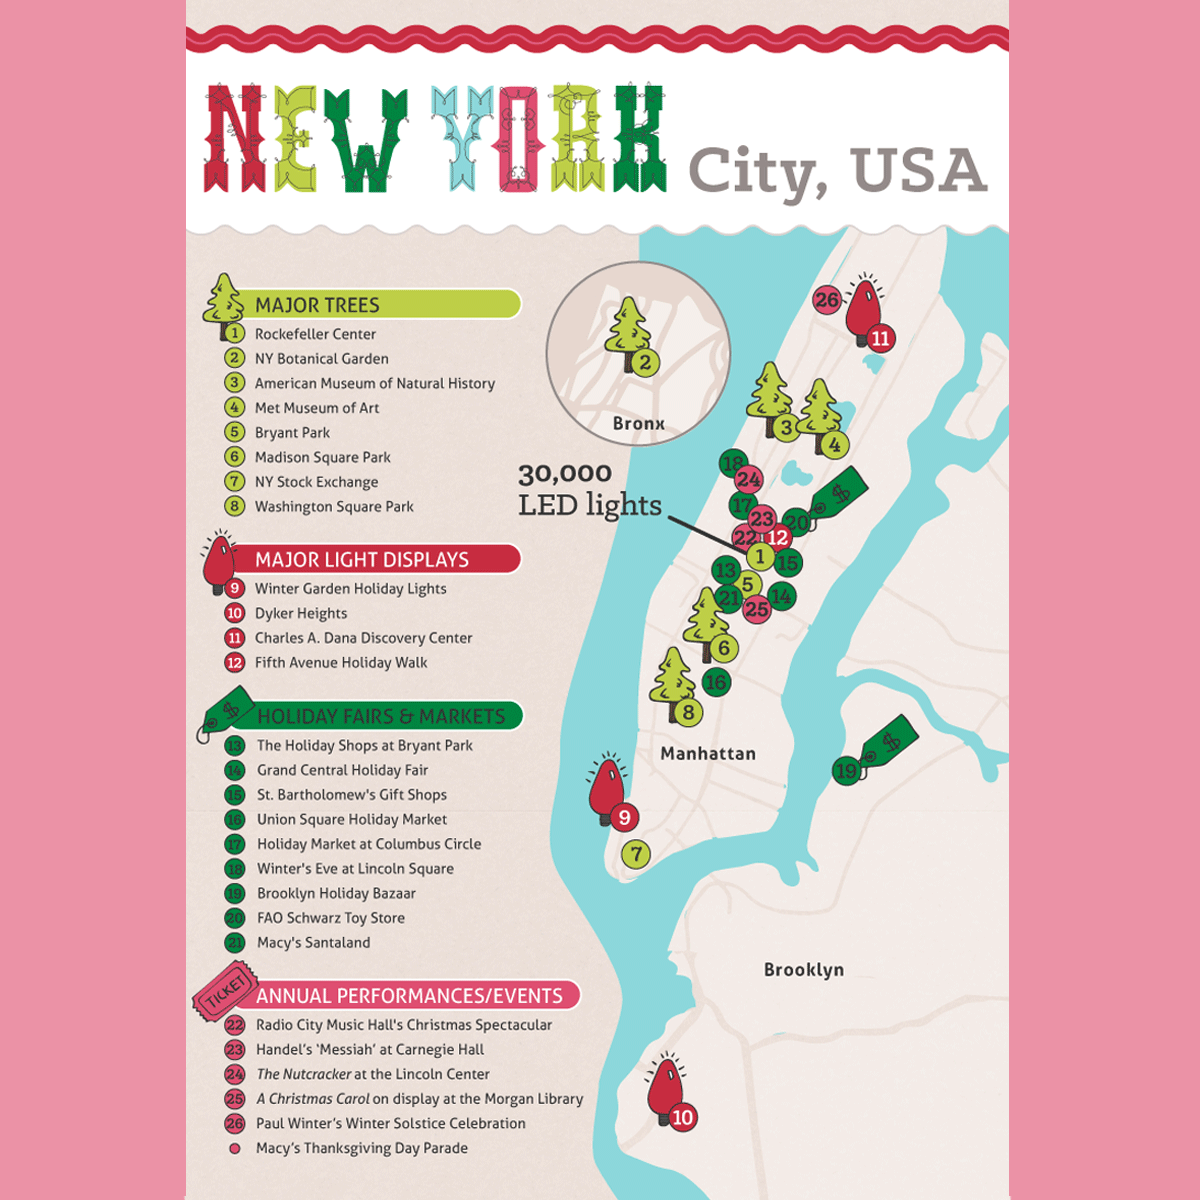
Builtvisible: Best Festive Cities Infographic
Digital: Map Illustration, Layout & Design
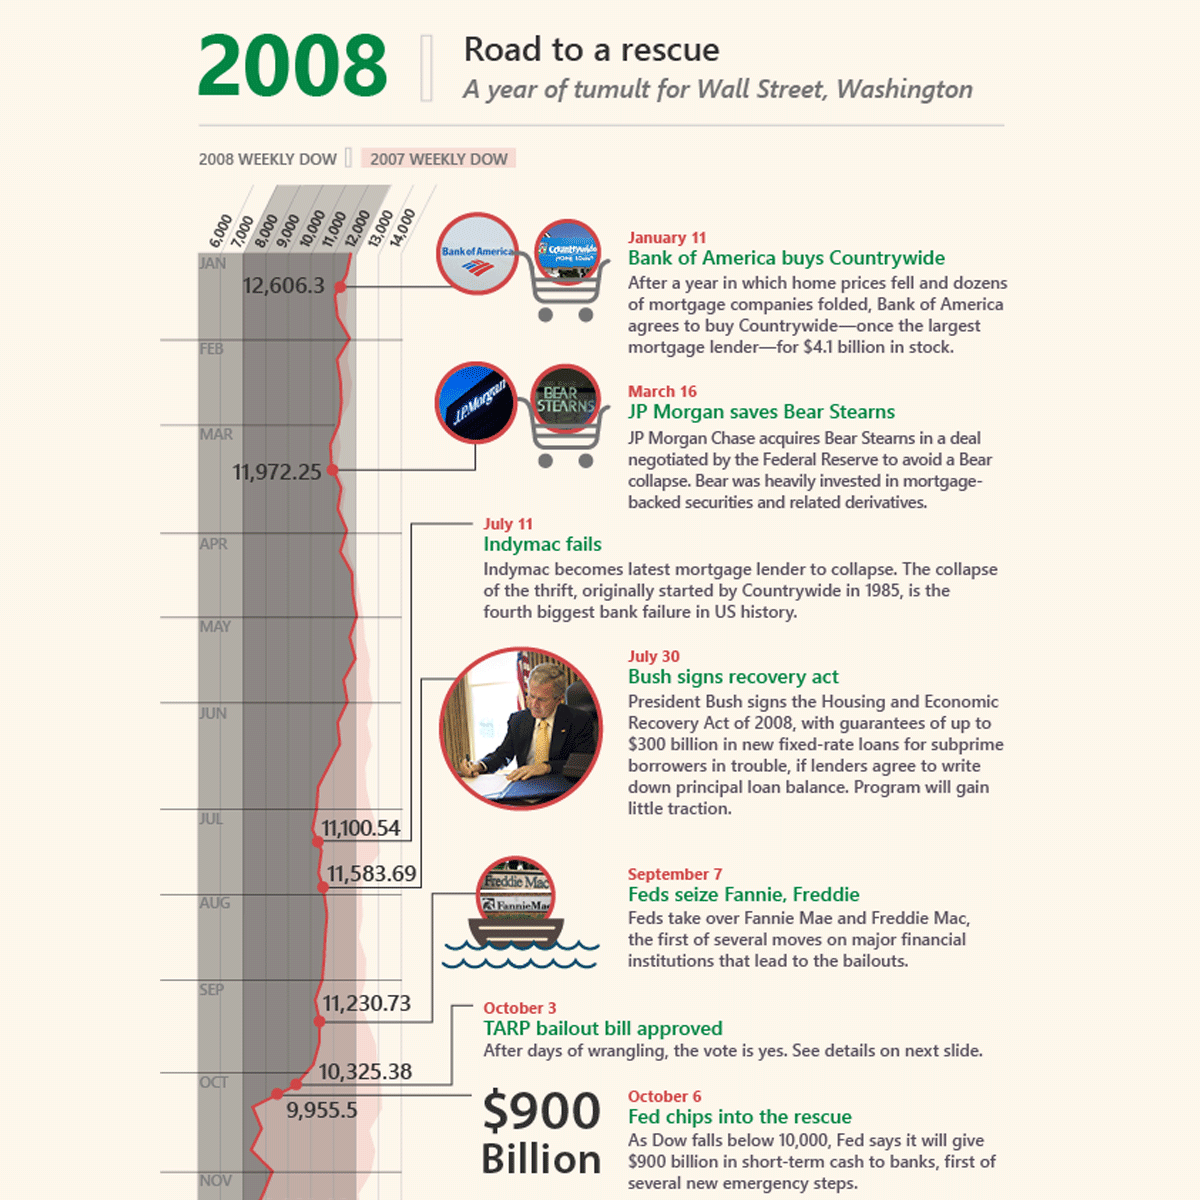
MSN Money: 4-part Financial Crisis Infographic
Digital: Layout & Design, Data Visualization, Illustration
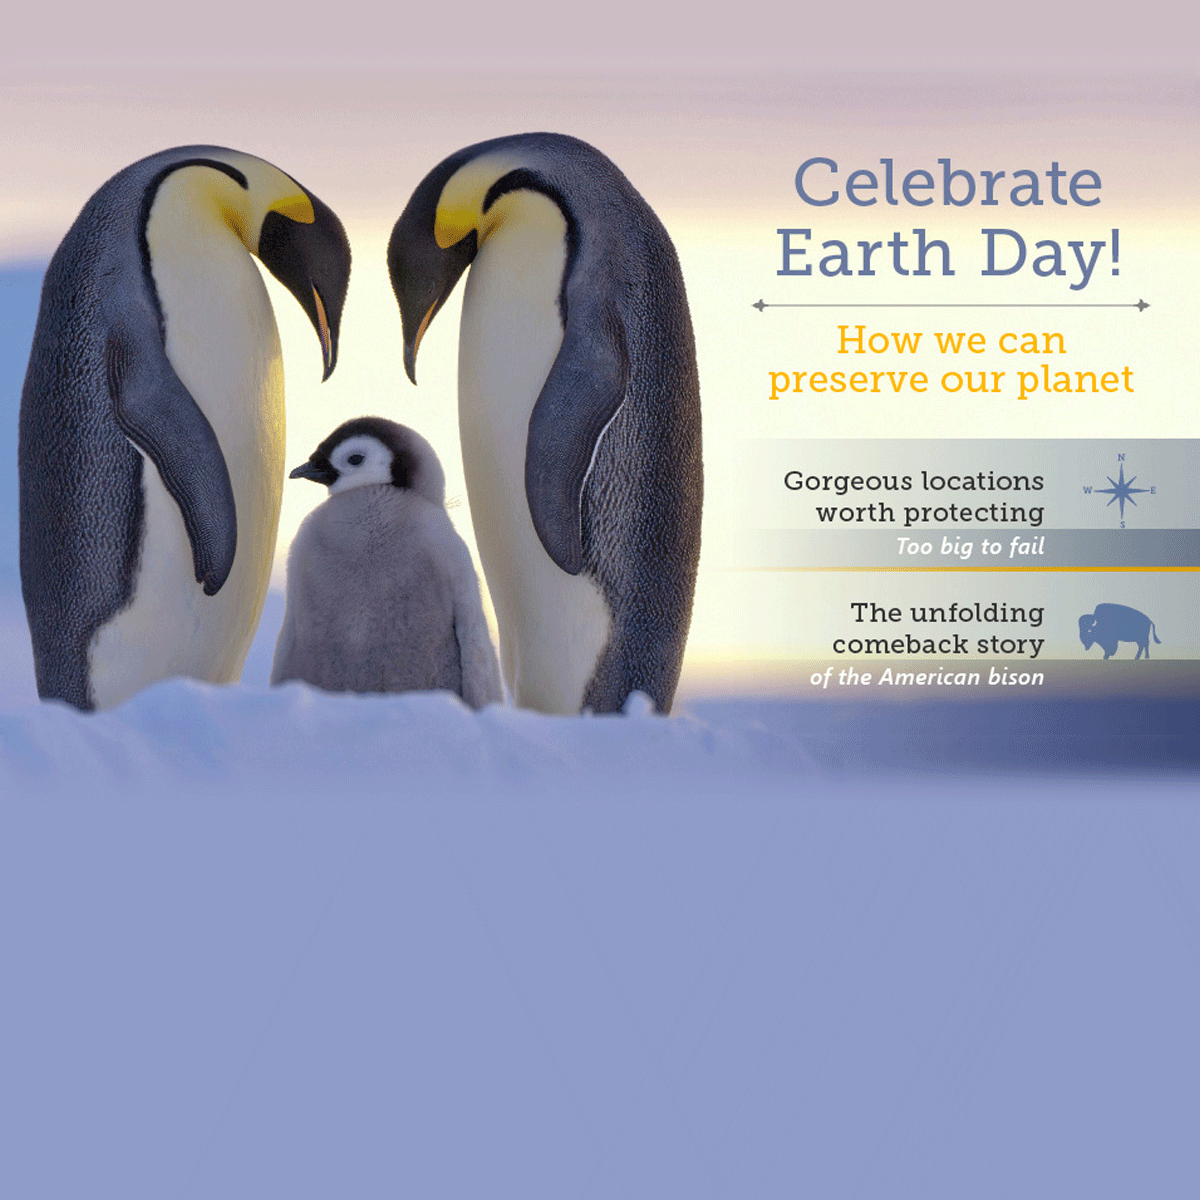
MSN: Landing Page for Earth Day
Digital: Layout & Design, Website
MSN Money: Labor Day Infographic
Digital: Layout & Design, Data Visualization
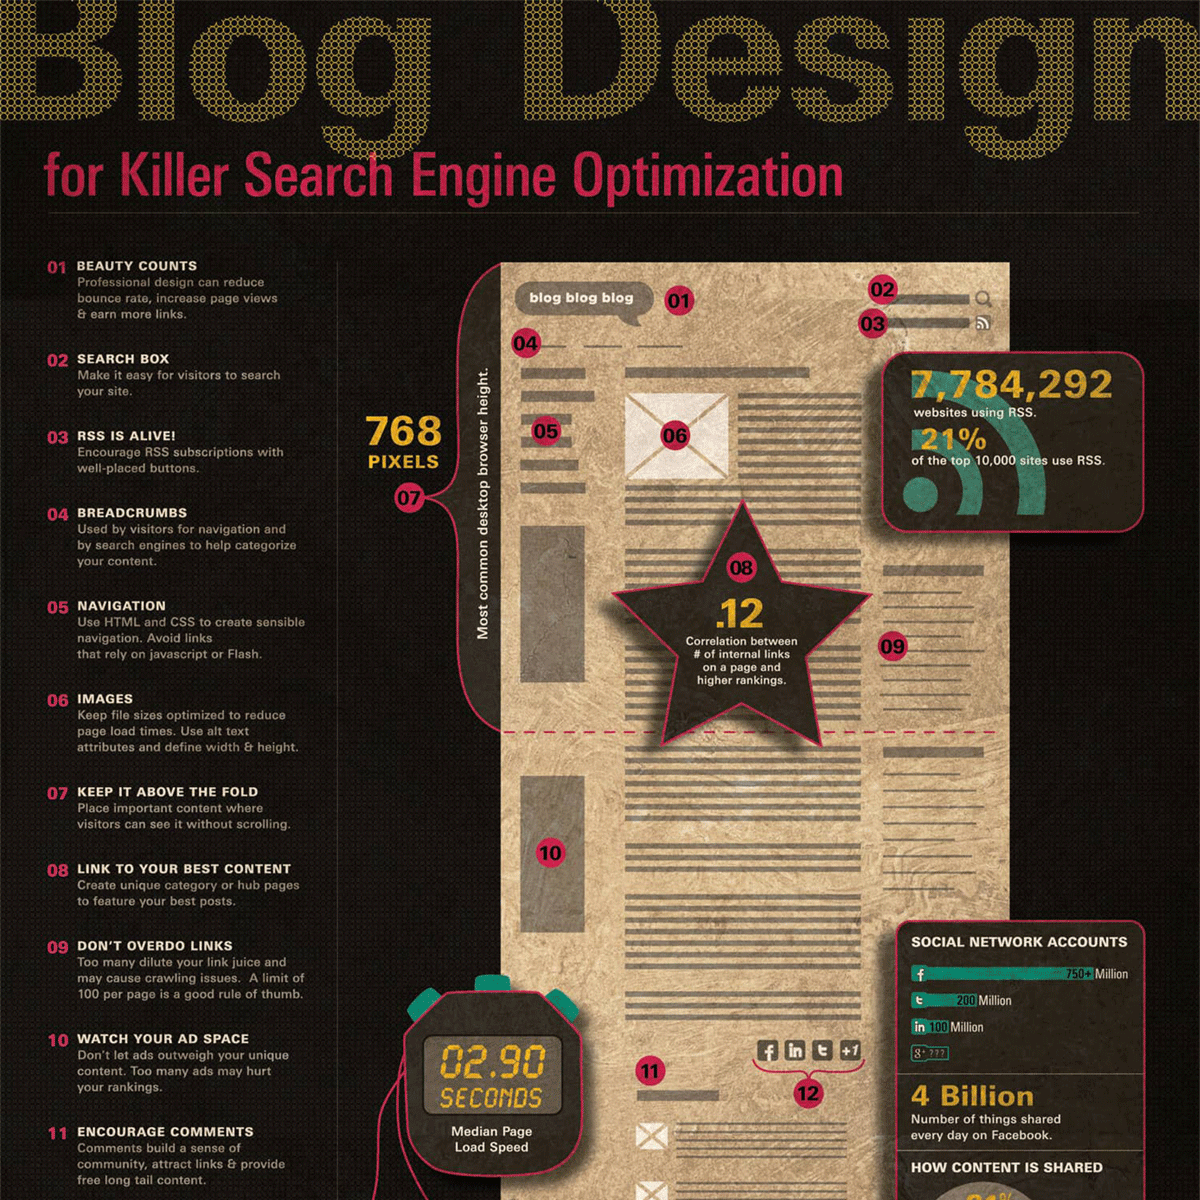
Moz: Blog Design for Killer SEO Infographic
Digital: Layout & Design, Data Visualization, Illustration